The Colorado River is having its worst water year on record in the same year its rulebook expires. The water world is openly debating a “Basin 2.0” redesign for a climate the 1922 Compact never imagined. This is the quantitative backbone for that argument: the four most-contested numbers, computed from public data, then turned into a costed, financeable portfolio.
The thesis in one line: the river carries far less than it was promised, so demand has to come down, and that part is settled physics. The fights over how are accounting fights, the disputed quantities are already measurable, and agreed measurement is the cheapest lever nobody is pulling. Every figure below links to its primary source, and the data and code are on GitHub, so you can confirm and extend rather than take our word.
Chapter 1
The crisis is physical, the fight is the accounting
The river carries less than it promises and demand has to fall. But the fights that decide who gives up what are fights over numbers. Here are the four that matter, computed from public data, and fifty years of the ledger.
The 60-second version
Four numbers, from public data. Reservoir evaporation and conveyance losses run about 1.55 million acre-feet a year, and no apportionment fully carries them. They are the larger part of what is called the structural deficit. Satellite gravimetry puts basin terrestrial water storage down roughly 46 km³ since 2002, in line with the published ~52. That is a change in stored water across reservoirs, soil and groundwater rather than a consumptive-use ledger, and part of it is drought rather than permanent loss. The groundwater component is the part no accounting tracks. Lower Basin forage grows the river’s lowest-value-per-drop crop, and the Glen Canyon release now stays above the bass-spawning threshold for months each year (mid-June to October in 2022), where it almost never did before.
Every post-2026 proposal shares one blind spot. They have started to price evaporation, but not one accounts for the groundwater drain, the loss no meter sees.
Measurement is the cheapest first move. A shared satellite-and-sensor ledger does not decide who absorbs the cut, that is the political fight, but it is the low-cost, low-regret step that makes every other fight tractable.
Everything below the recommendations is a clearly-labeled exploratory model of costed solutions and financing, useful for scale and structure, but built on softer, editable assumptions than the measured findings.
Why physical first, then accounting? Peer-reviewed modeling of United States water stress finds that what a river can deliver is set by its dams and canals as much as by its runoff, and that accounting for conveyance and storage cuts modeled water stress by more than half. [1] On a fully plumbed river like the Colorado, the shortfall we measure is what remains after the infrastructure has already done its work, so the unresolved fight is over the ledger, not the pipes.
This asset is computed by AI from public data and is seeking review from named water-sector experts before formal publication. See who we are asking.
The evidence · four measured findings
1.2–1.5MAF / yearReservoir evaporation and system losses, charged to no state’s allocation [2][3]
The loss no one was charged for
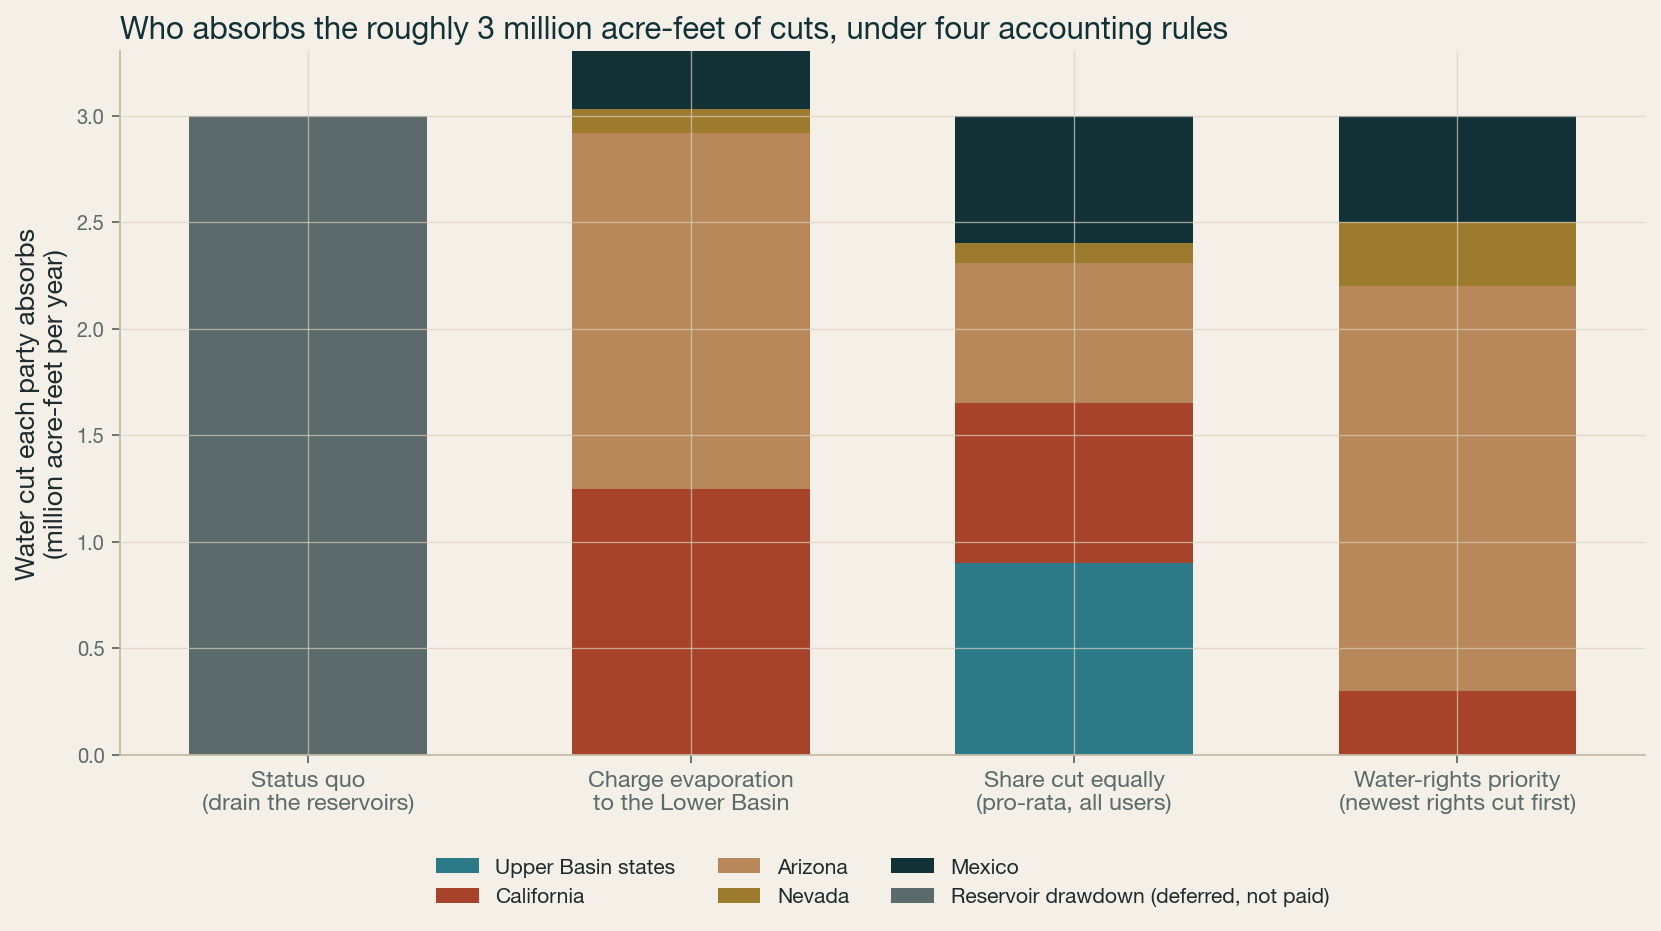
Since Arizona v. California (1964), Lower Basin evaporation and system losses have been booked to neither state and simply drained the reservoirs [4]. Charging them, as the Upper Basin proposes [5], moves over a million acre-feet of cut onto Arizona and California first. The measurement is not optional.
Click to enlargeHow a 1.2 to 1.5 million acre-foot cut lands on each state under four different accounting rules. Charging evaporation to the Lower Basin, which the Upper Basin wants, puts most of it on Arizona and California.
−1.5MAF / yearTotal water storage lost, across reservoirs, soil, and unmeasured groundwater [6][7]
The larger loss no proposal counts
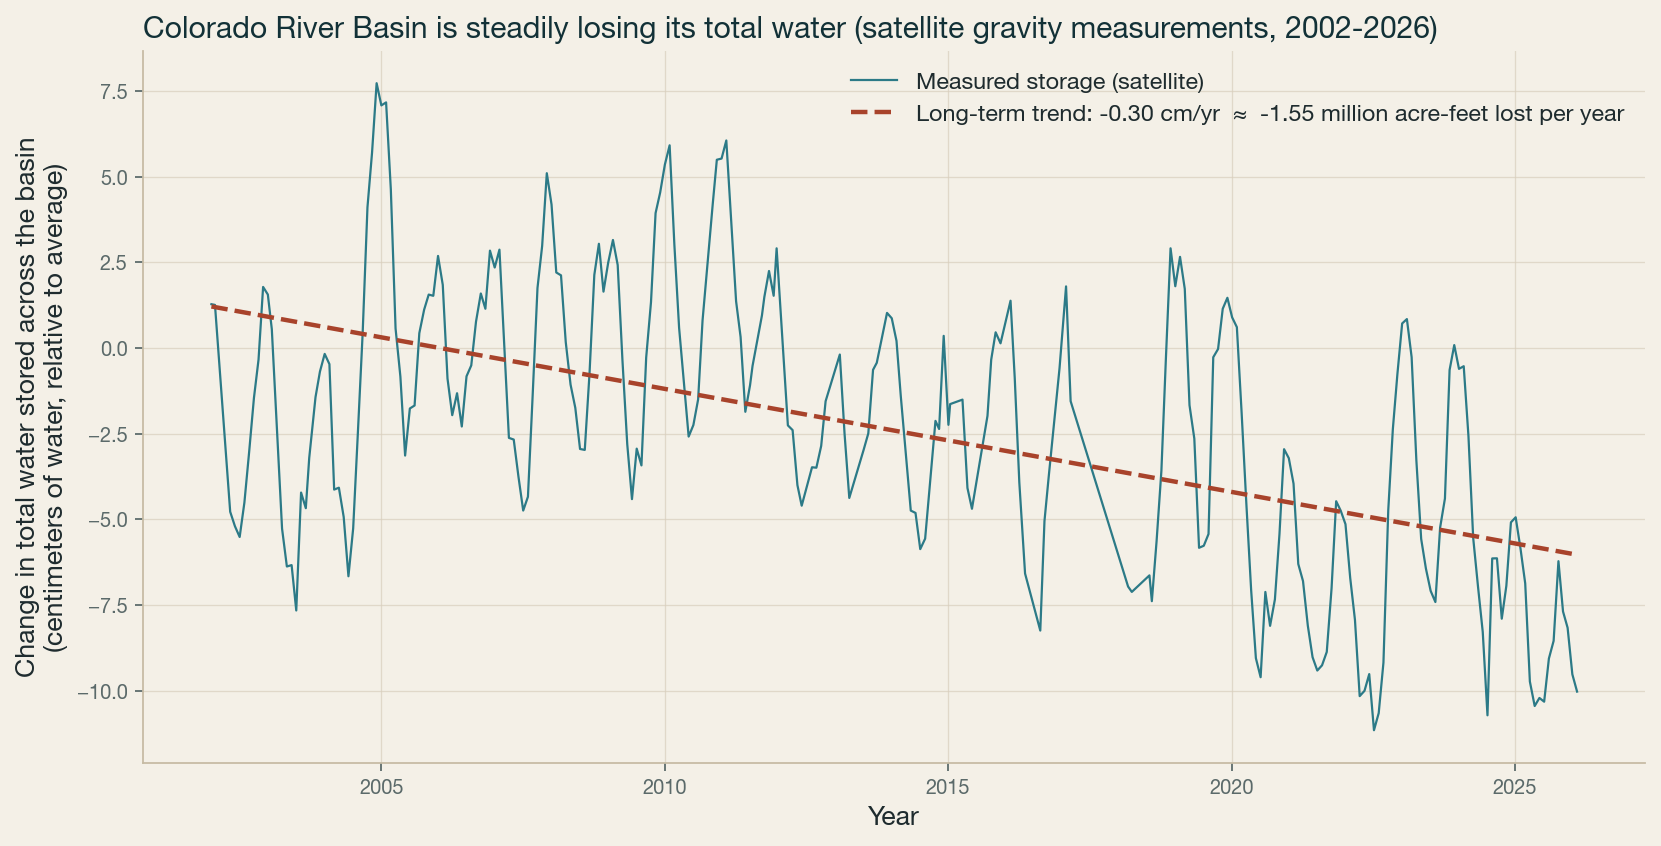
GRACE satellites show roughly 46 km³ (37.6 MAF) of water gone since 2002, in line with the published ~52 km³ benchmark, draining far faster now. We ran the decomposition directly against GLDAS soil-moisture and snow plus reservoir accounting: of the ~1.5 MAF/yr lost, reservoir drawdown is the largest visible piece, soil moisture and snow another share, and groundwater a smaller but deeply uncertain residual, our method lands near 10–30%, the published literature near two-thirds [8]. The methods disagree, and honestly so: the groundwater signal is a residual that amplifies every error. What is not in doubt is that groundwater is a real, largely unrecoverable loss the surface-water accounting of the Law of the River cannot see, and that no allocation proposal tracks it.
Click to enlargeSatellite gravity data showing the total water stored in the basin falling steadily since 2002, roughly 1.5 million acre-feet lost every year that the surface-water books never see.
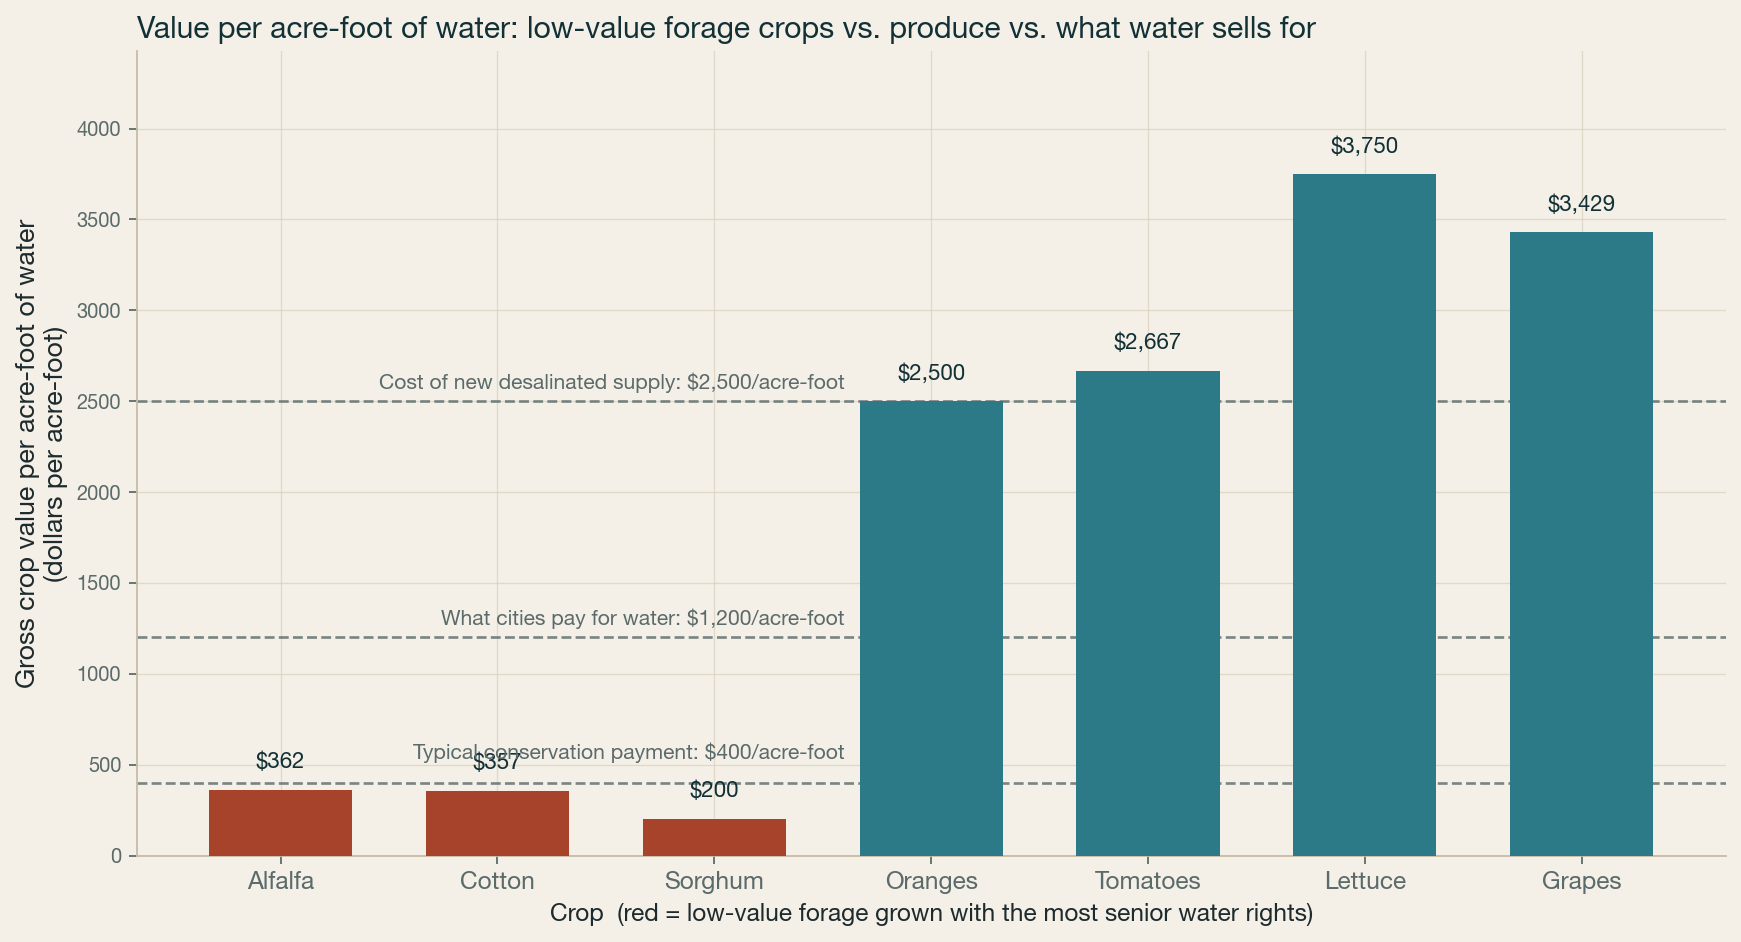
~10×value gapThe same acre-foot of water grows ~$360 of forage or ~$3,750 of produce [9][10]
The scarcest water grows the cheapest crop
In four Lower Basin counties, forage consumes ~2.05 MAF while returning only ~$360/acre-foot of gross crop output [11], produce returns roughly ten times that. (Gross output overstates the water’s own value, which nets out land and labor, so read the gap as directional, not exact.) The point holds: compensated fallowing of low-value forage is the cheapest large block of water, and conservation should be paid on measured consumptive use [12], not diversions.
Click to enlargeWhat an acre-foot of water is worth by how it is used. Low-value forage, grown on senior water rights, sits far below what cities and industry would pay for the same water.
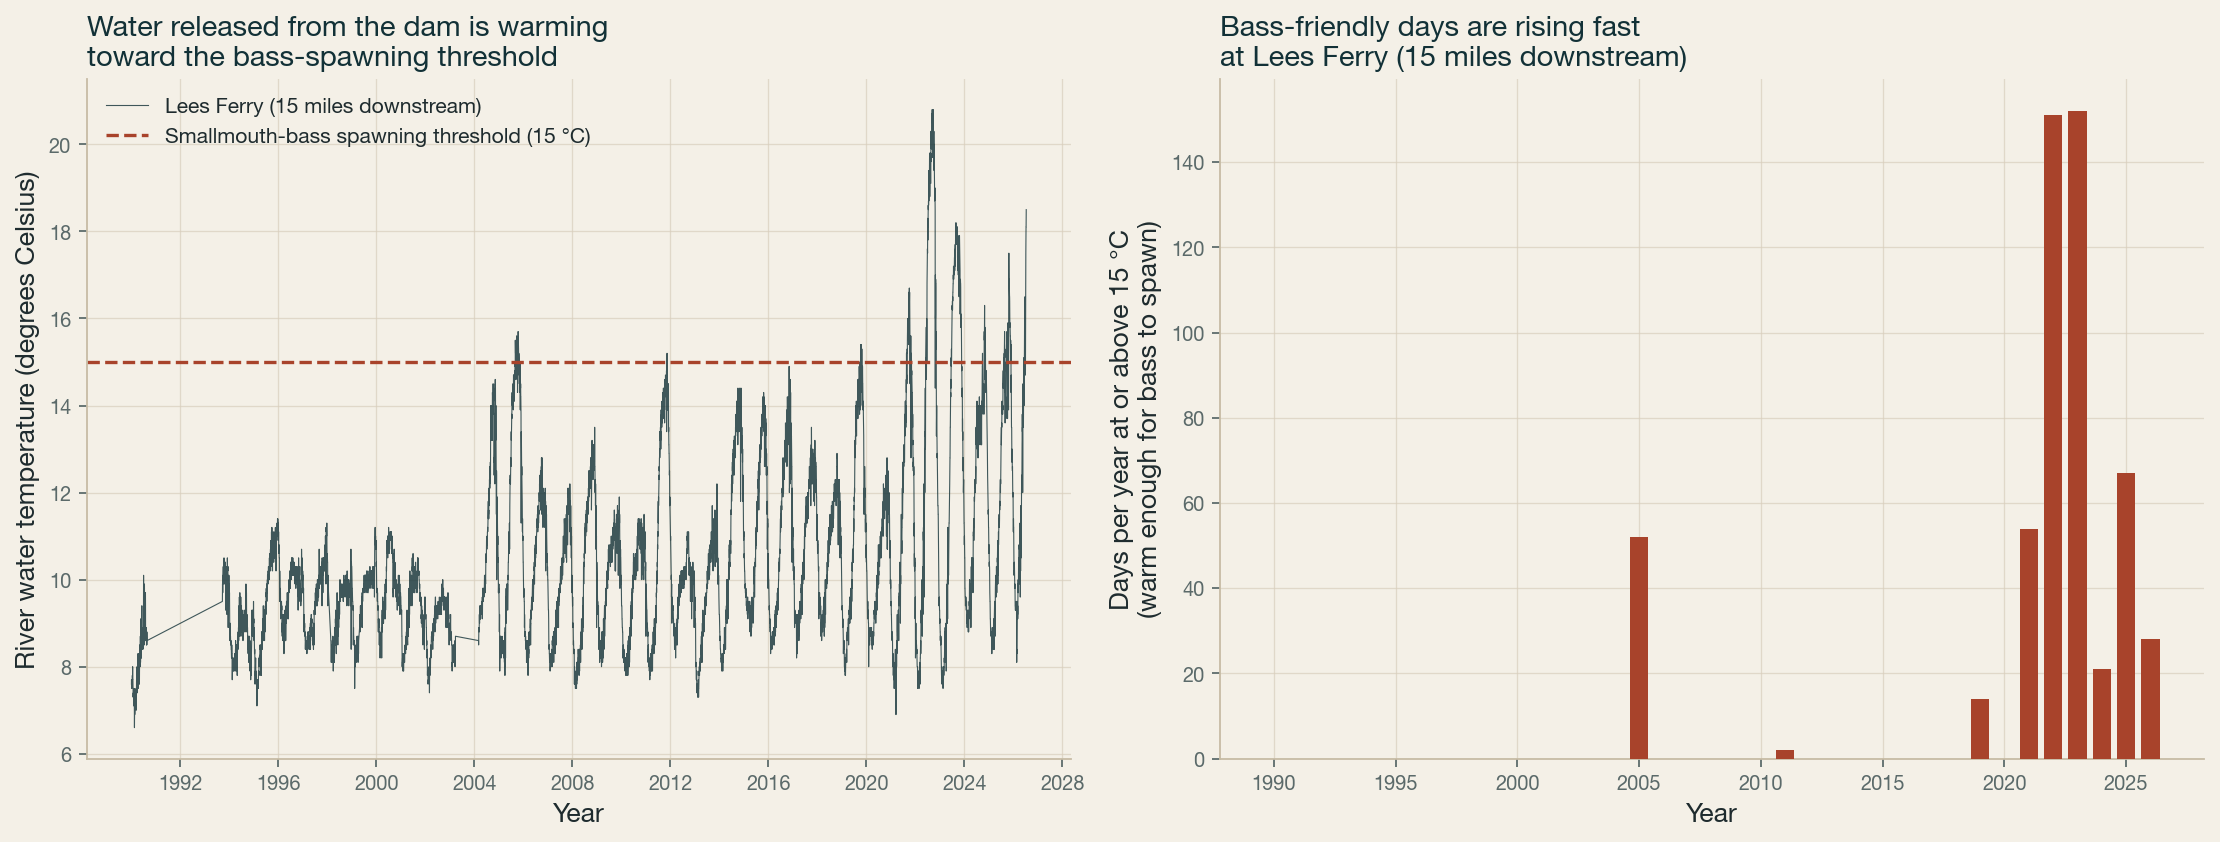
monthsper yearThe dam release now exceeds the 16°C bass-spawning threshold, versus almost never before 2015 [13]
A national park run by power revenue
As Lake Powell fell, the dam released warmer water. Bass-suitable days rose from ~2 to ~41 a year (11,654 USGS readings), and smallmouth bass now pass into the last humpback-chub stronghold [14][15]. Cool-mix flows work but are contested by hydropower [16]. The physics is predictable, so the trade-off can be priced.
Click to enlargeWater temperature released below Glen Canyon Dam. As the reservoir drops, releases warm past the line where invasive bass can spawn and native fish struggle.
The ledger, over fifty years
Half a century of Reclamation’s own accounting
We parsed Reclamation’s 1971 to 2024 consumptive-use dataset. The record is more nuanced than the headlines, and it points conservation at a very specific place [17].
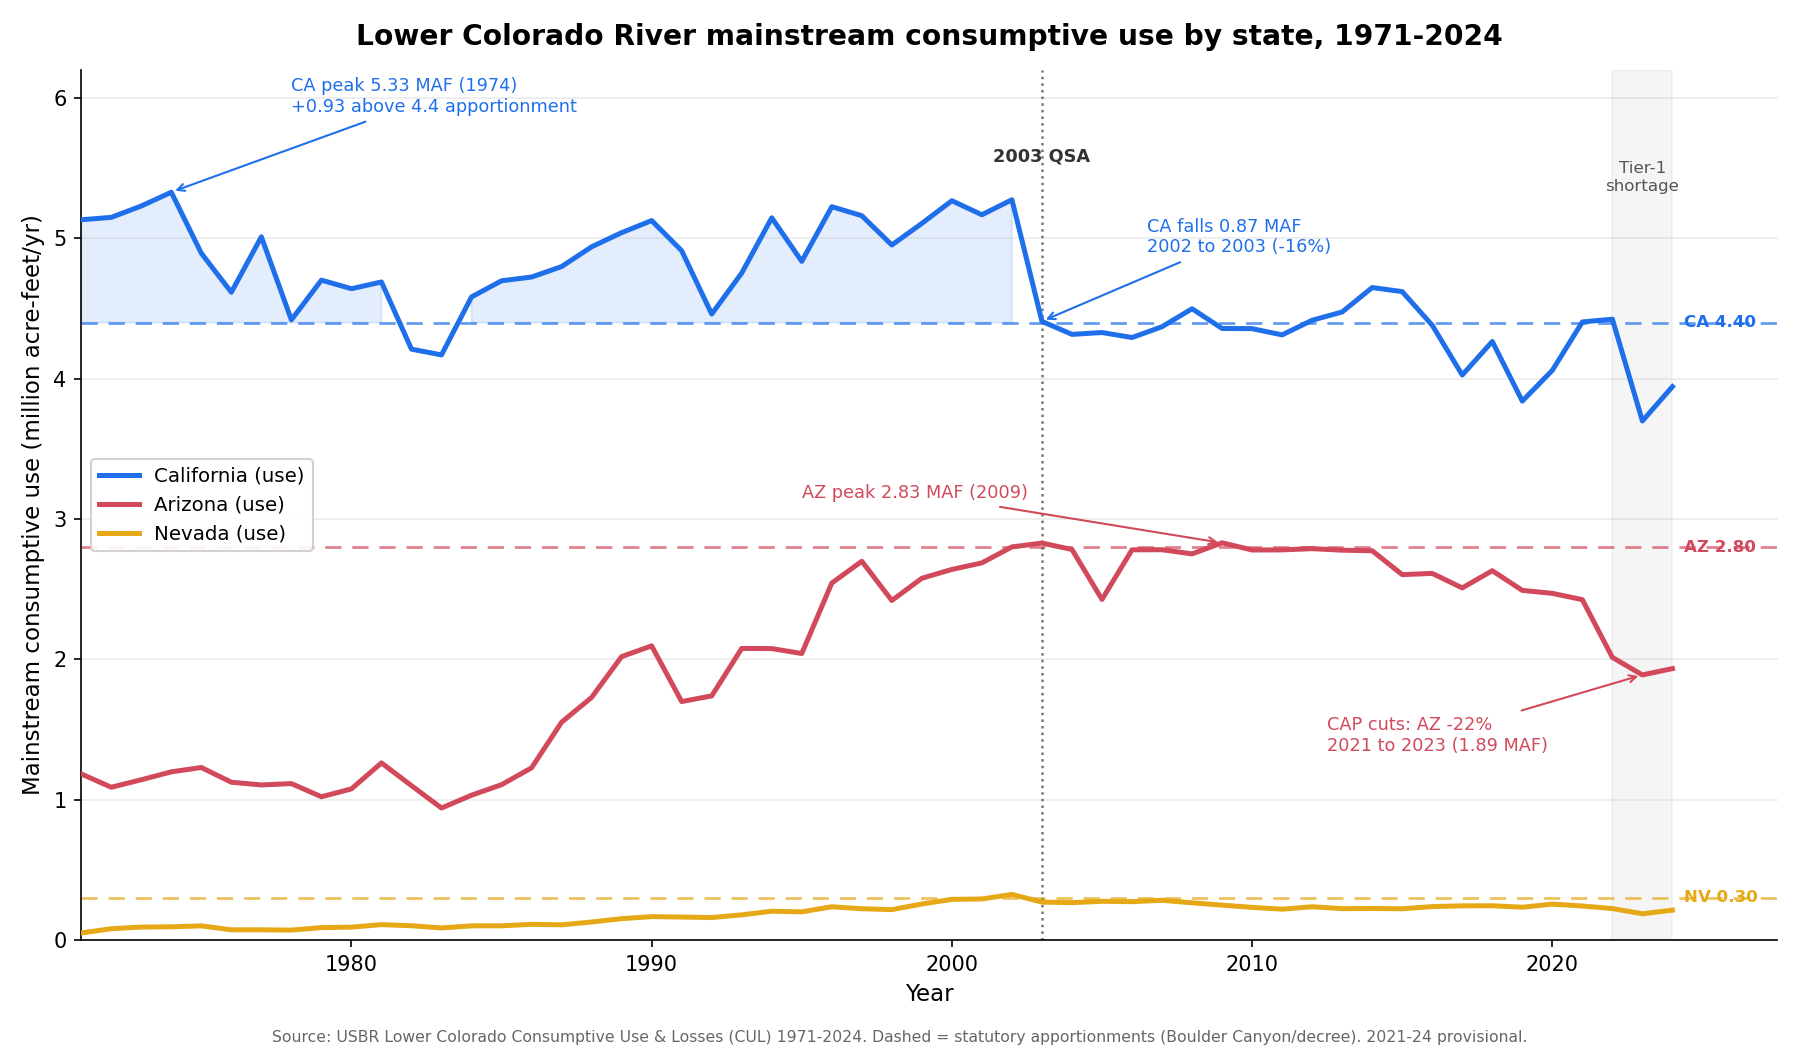
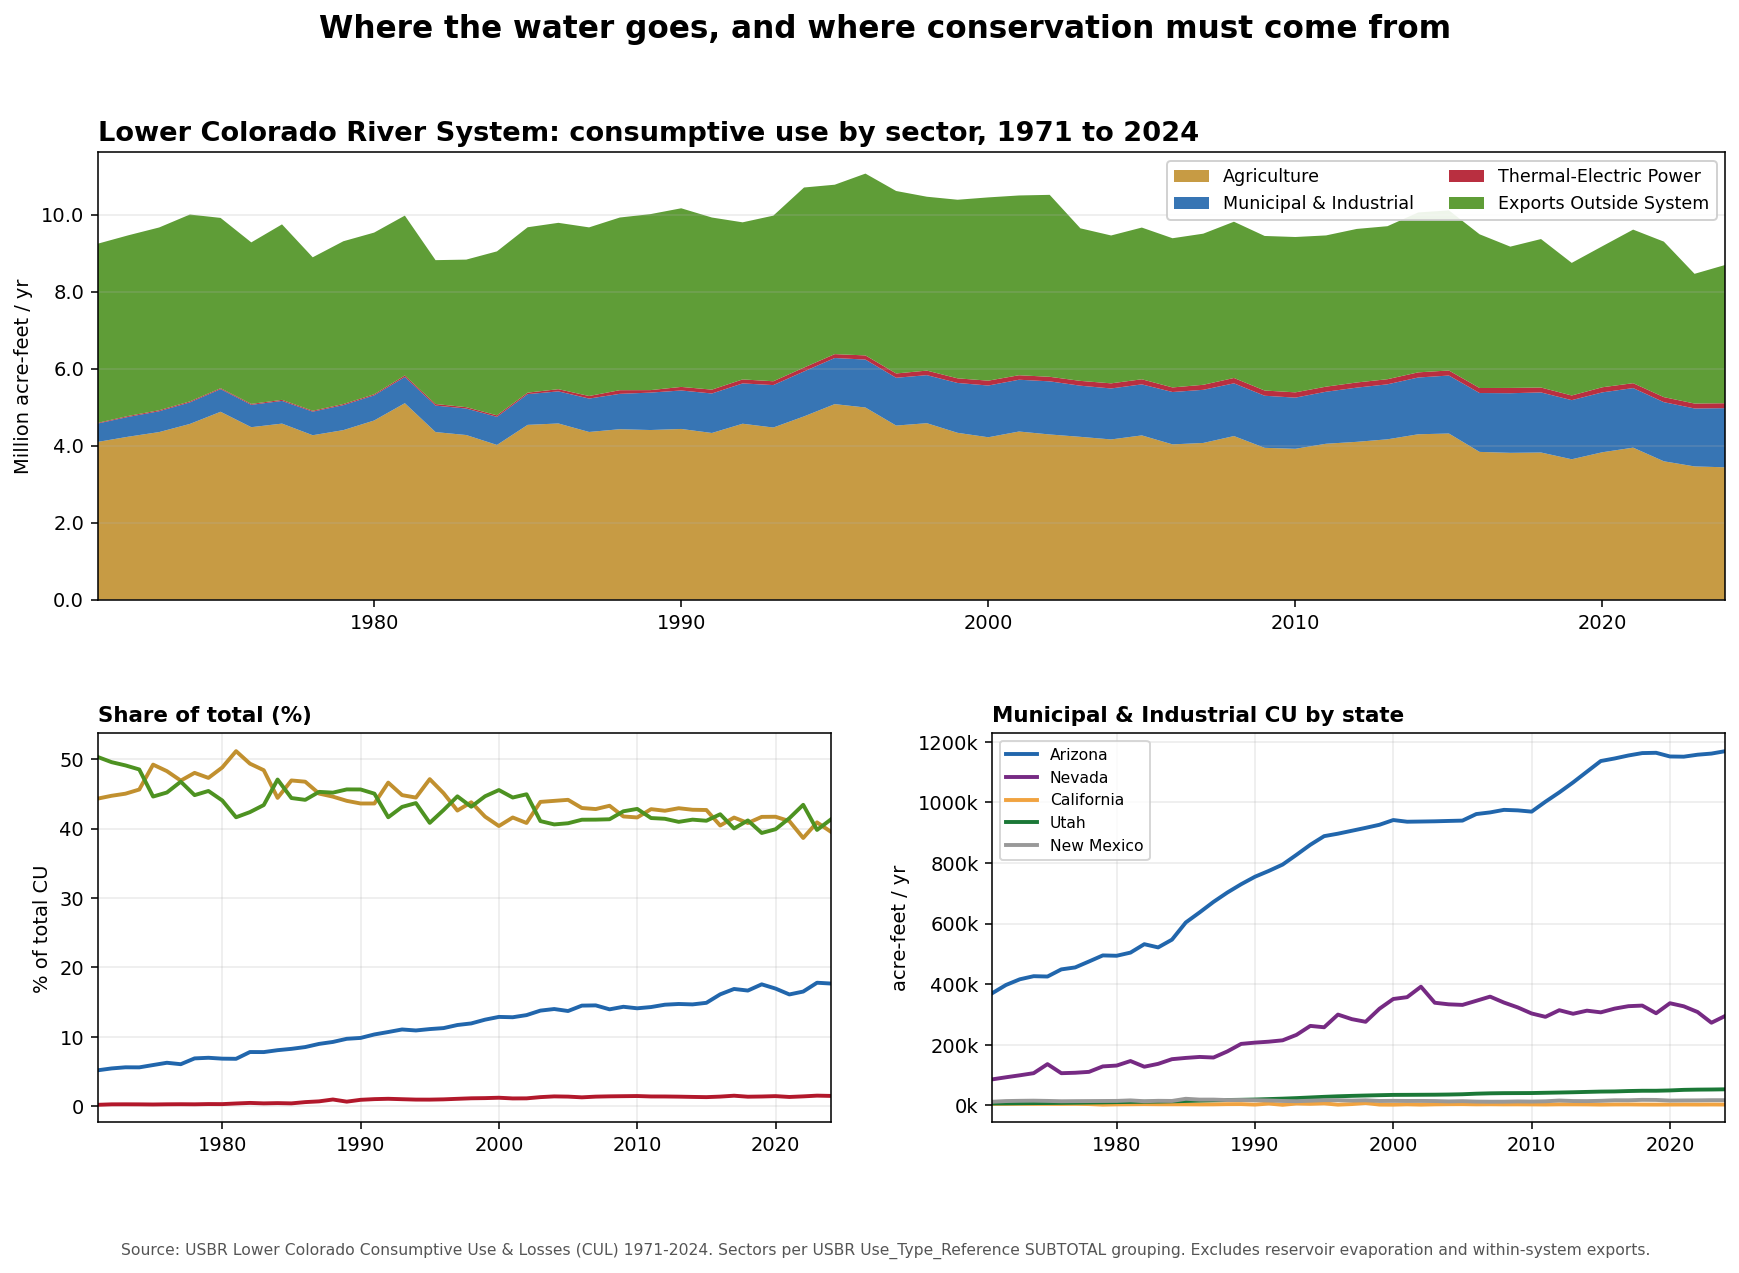
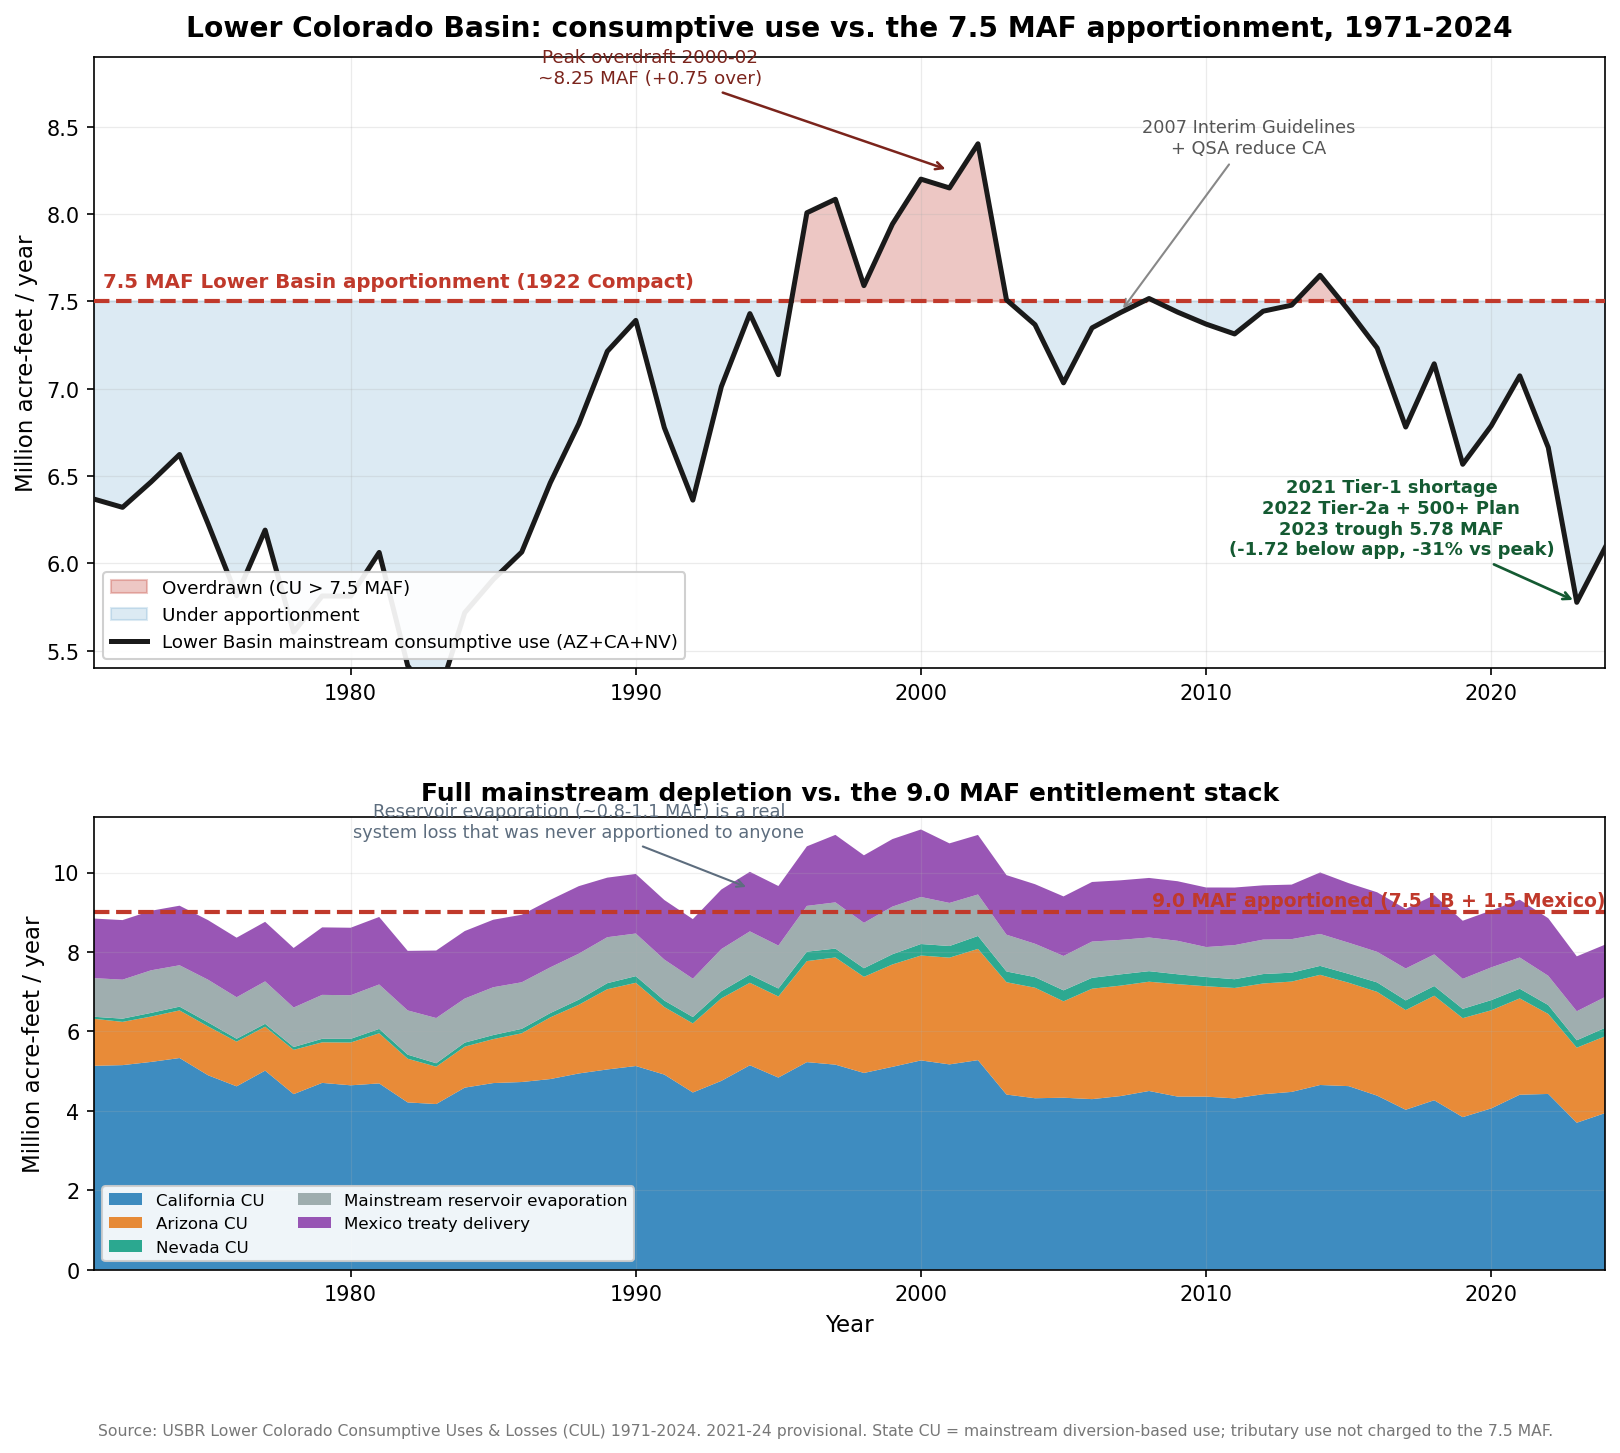
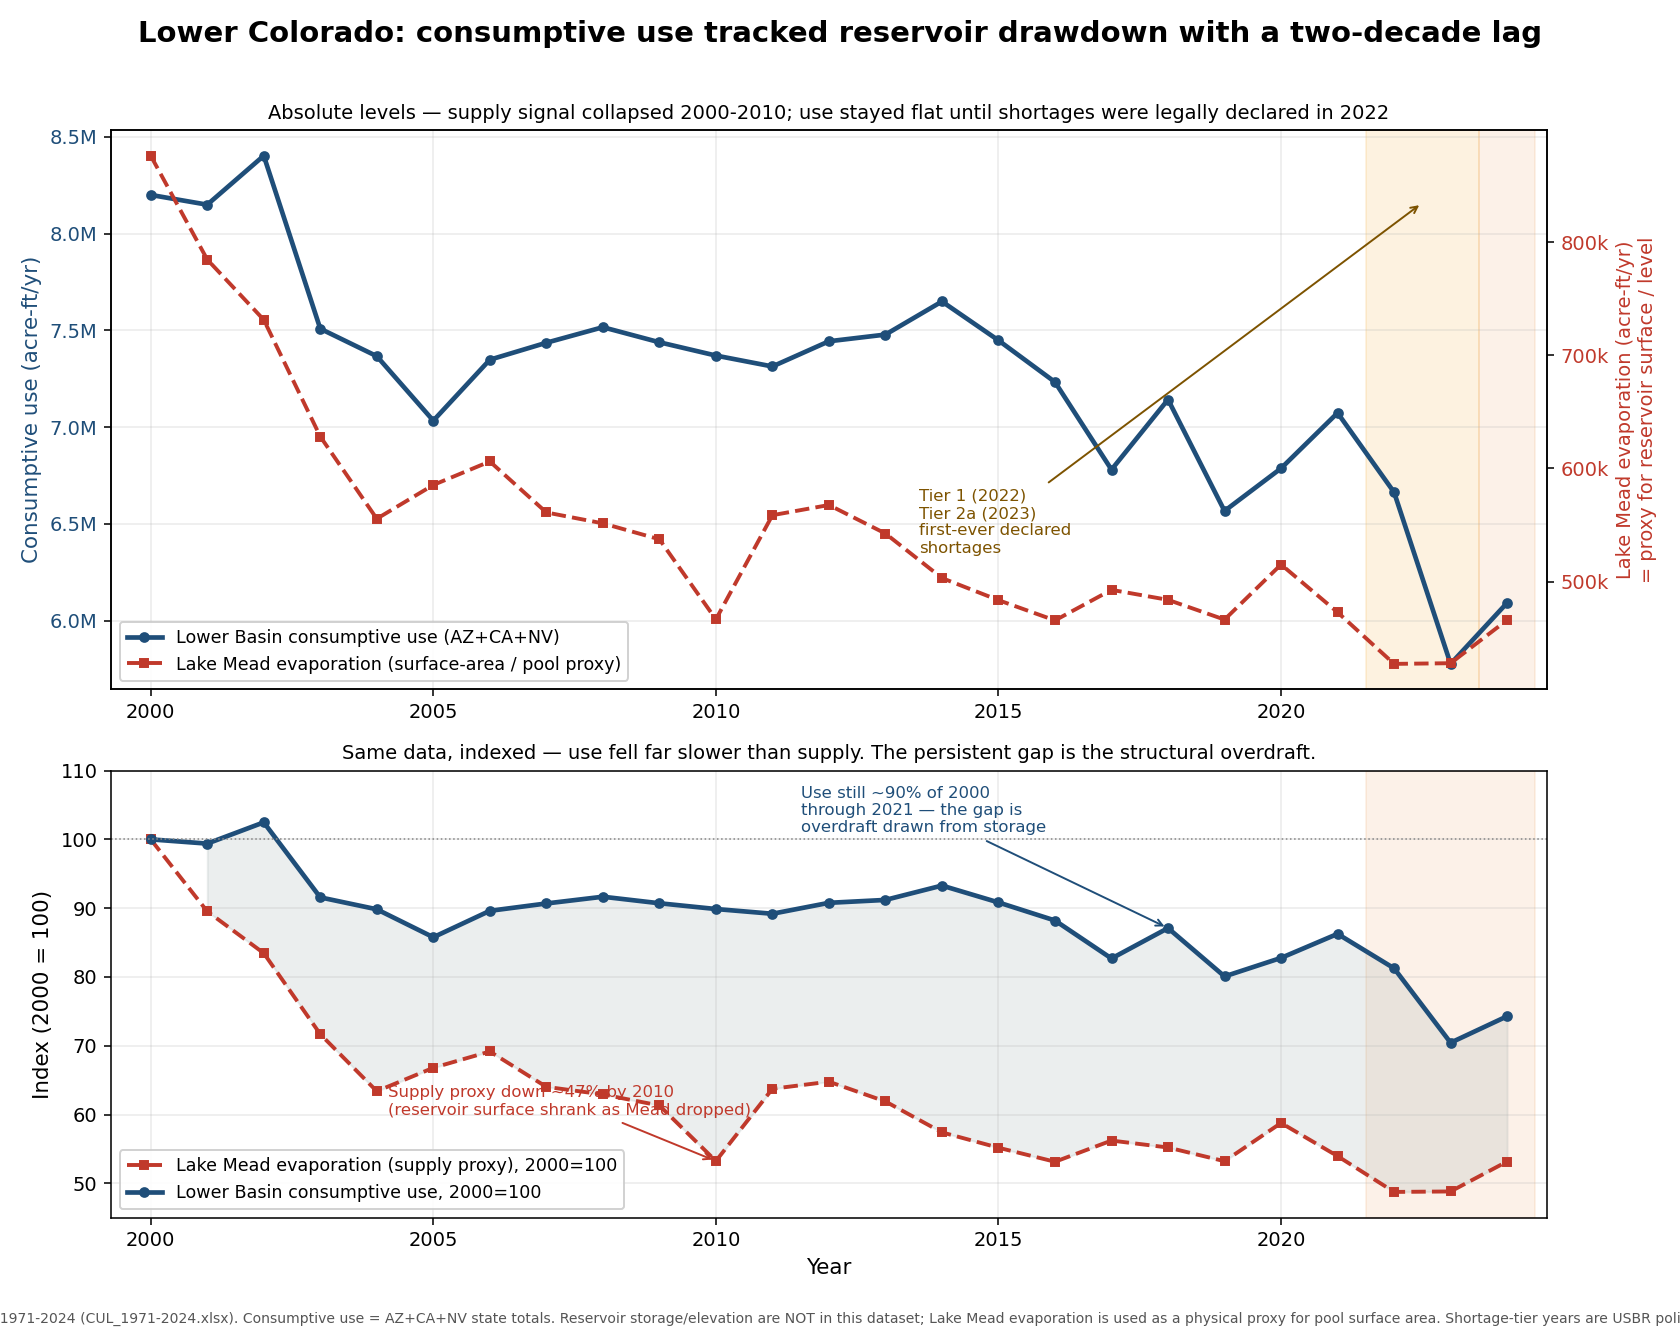
Click to enlargeCalifornia ran a three-decade overuse era (peak 5.33 MAF in 1974) that ended in a single year after the 2003 QSA. Arizona’s CAP absorbed the recent shortage cuts.Click to enlargeWhere the water goes. Agriculture dominates. Cities and power are a small share, so conservation volume has to come from farms and California’s exports, not from data centers.Click to enlargeLower Basin use against its 7.5 MAF apportionment. For 44 of 54 years the basin was under its cap. The ledger only looks balanced today because the reservoirs physically shrank.Click to enlargeUse stayed flat near 7 MAF from 2003 to 2021 while Lake Mead’s surface roughly halved. The 2021 to 2024 cuts were triggered by shortage-tier thresholds tied to Lake Mead elevation, so they track policy tiers layered on hydrology and can be relaxed when levels recover. They are policy-contingent, not durable.
The real gap is ~1 MAF of unapportioned evaporation, and one IID deal covers most of the conservable volume
Reservoir evaporation of roughly 1 MAF a year sits on top of a 9.0 MAF entitlement stack that no one apportioned. And the conservable water is concentrated: Imperial plus Palo Verde plus Yuma hold about 98% of the top-ten conservable agricultural volume, so a single Imperial agreement covers roughly 80% of it. The negotiation is smaller than it looks.
Chapter 2
Why today’s plans fall short
Every proposal on the post-2026 table is silent on the three things the science says to do. Account for the losses, route cuts to the lowest-value water, and price the dam trade-off.
What the proposals miss
Ten proposals on the table, scored against the data
We scored every post-2026 proposal [18] against the four findings. They have started to price evaporation. None address the unmeasured loss, groundwater, and the operating rules run on a separate track from the ecological emergency.
Proposal
Max LB cut
Sufficient
Evap
Groundwater
Value/drop
Thermal
DEIS No Action
0.6
○
○
○
○
○
DEIS Basic Coordination
1.48
○
○
○
○
○
DEIS Enhanced Coord.
1.3–3.0
◒
◒
○
○
◒
DEIS Max Flexibility
up to 4.0
●
◒
○
○
◒
DEIS Supply Driven
up to 2.1
◒
◒
○
○
◒
Upper Basin (UDS)
1.5 to LB
◒
●
○
○
◒
Lower Basin bridge
1.25 + 1.0
◒
●
○
○
◒
Federal 10-yr framework
up to 3.0
●
◒
○
○
○
Minute 330 successor
~0.1 MX
,
◒
○
○
○
NAIWRSA (tribal)
settles rights
,
○
●
○
○
● addresses ◒ partial ○ misses · cuts in MAF/yr [18][5][19]. Every allocation proposal marks ○ on groundwater, that column is the story.
Chapter 3
The fix, a costed portfolio
No single sector closes the gap. Rebuild the buffer with a stack of real, measured supplies, cheapest first. Then move the sliders and build your own path.
Colorado River finance and data
Rebuilding the buffer, not just closing the gap
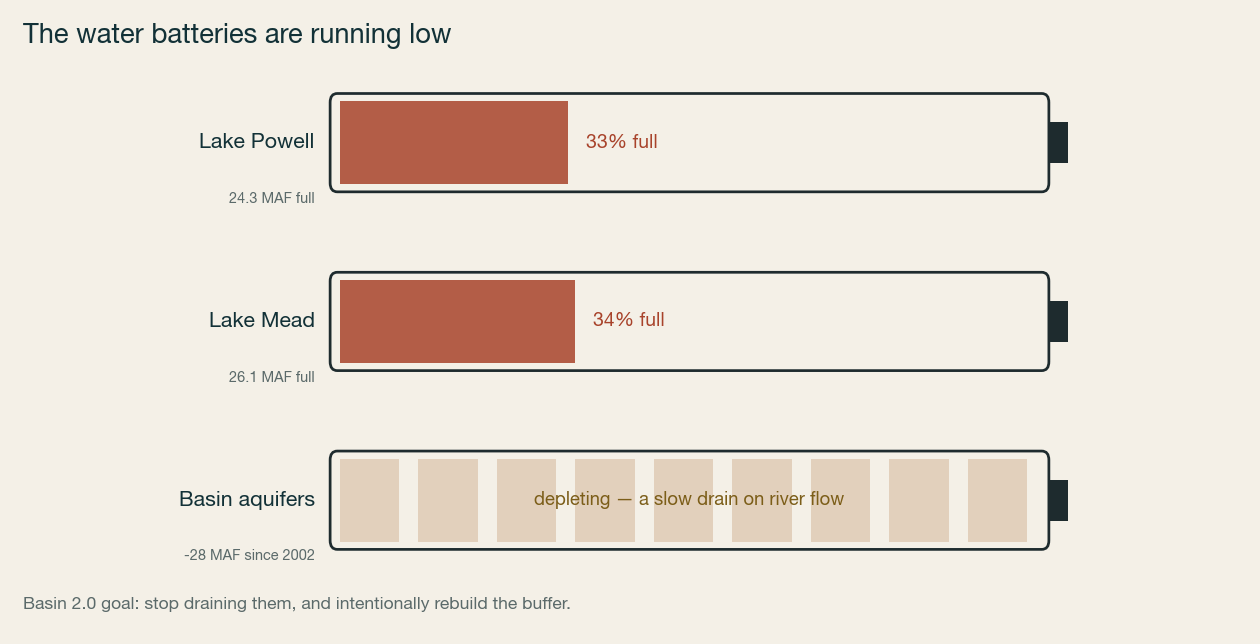
The real task is bigger than covering a single bad year. The river lost its cushion. Mead and Powell have both fallen far from full, and the aquifers that once helped steady the system are down by about 28 MAF since 2002. That slow drain pulls on river flow too. The goal is to refill storage, restore operating room, and keep the basin from running on empty.
Mead holds 26.1 MAF when full and Powell 24.3 MAF. Both are now near a third full. That is not a normal operating posture. It is a warning that the system needs deliberate replenishment. Our energy-decoupling and recharge work serves that goal directly. It is not only about reducing demand. It is about rebuilding the buffer that lets the basin absorb drought, delay, and error. Click to enlarge
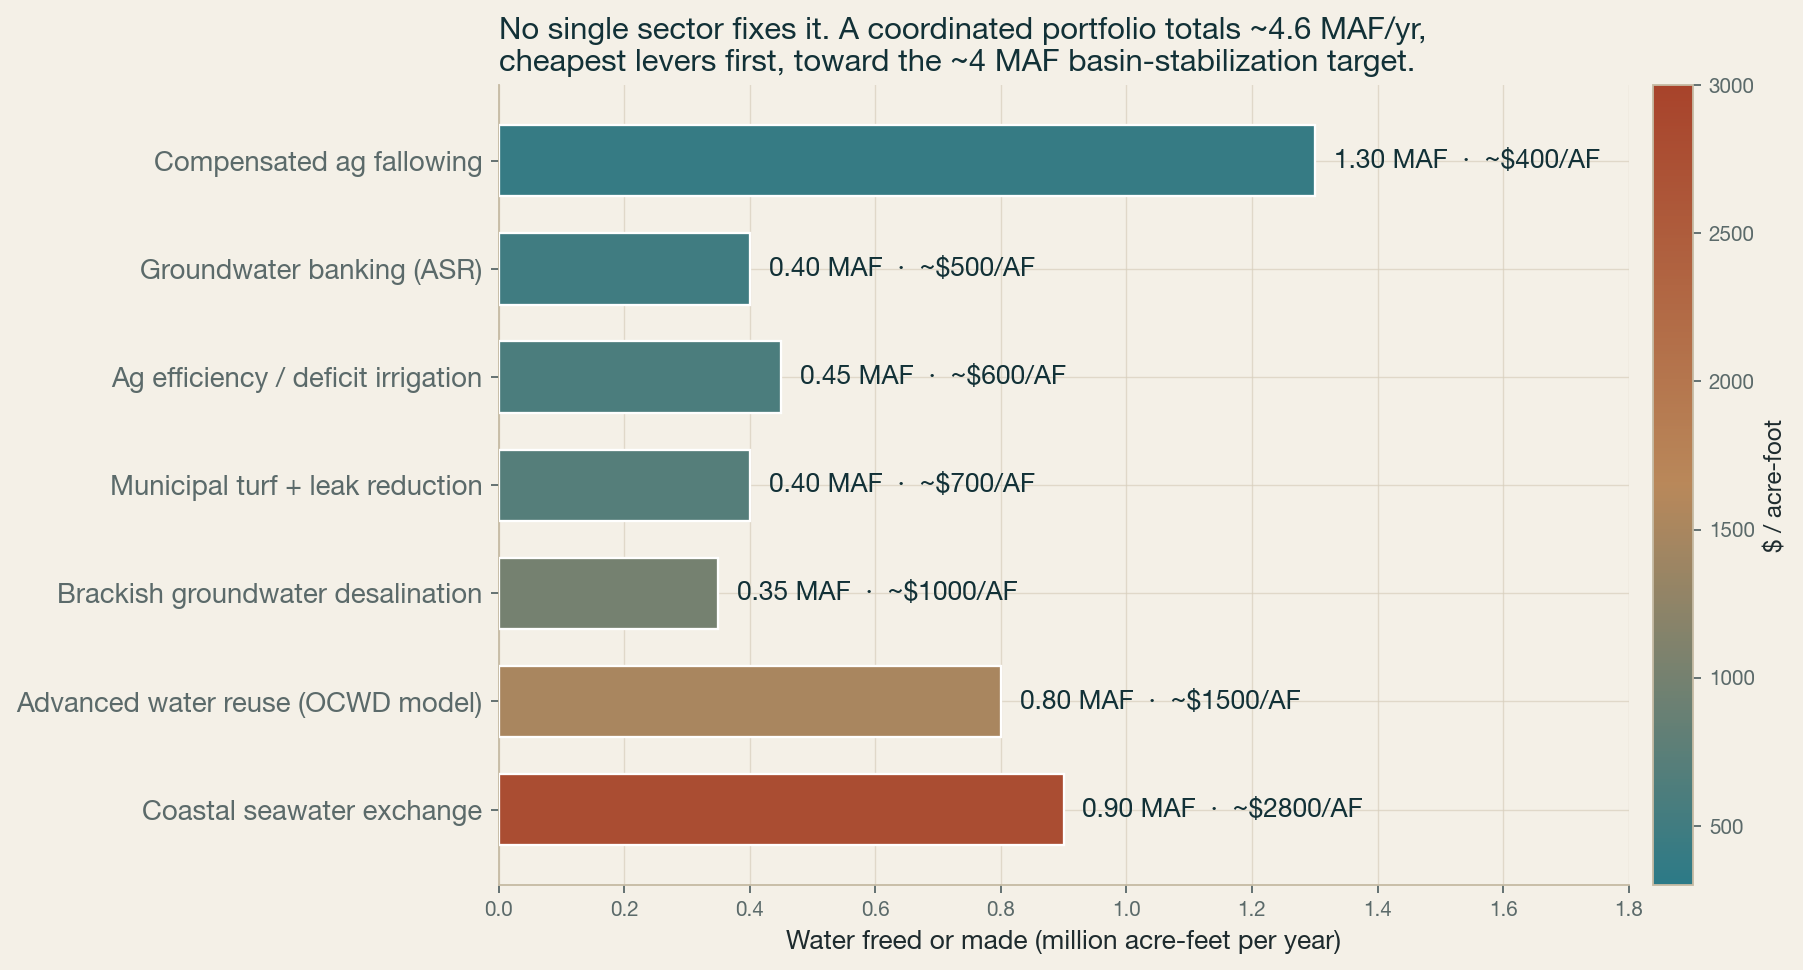
A basin-scale fix needs a portfolio.
No single sector can deliver the scale Kloos targets, which is roughly 4 MAF, a full-basin stabilization target at or just above the ~3 MAF/yr stabilizing cut this model derives, not a fourth kind of deficit. Farms, cities, industry, groundwater, and operations all have to contribute. Our own verified consumptive-use conservation starts at about $400 per acre-foot paid to the user. Load in measurement, verification, legally shepherding the water to Lake Mead, and a durability premium, and the all-in delivered cost runs closer to $600 to $1,000 per acre-foot, still the cheapest real supply in the basin. The water is conserved, shepherded through the system, measured, and paired with a holdback so it actually stays available. The point is not one silver bullet. It is a coordinated stack of real, auditable supplies. Click to enlarge
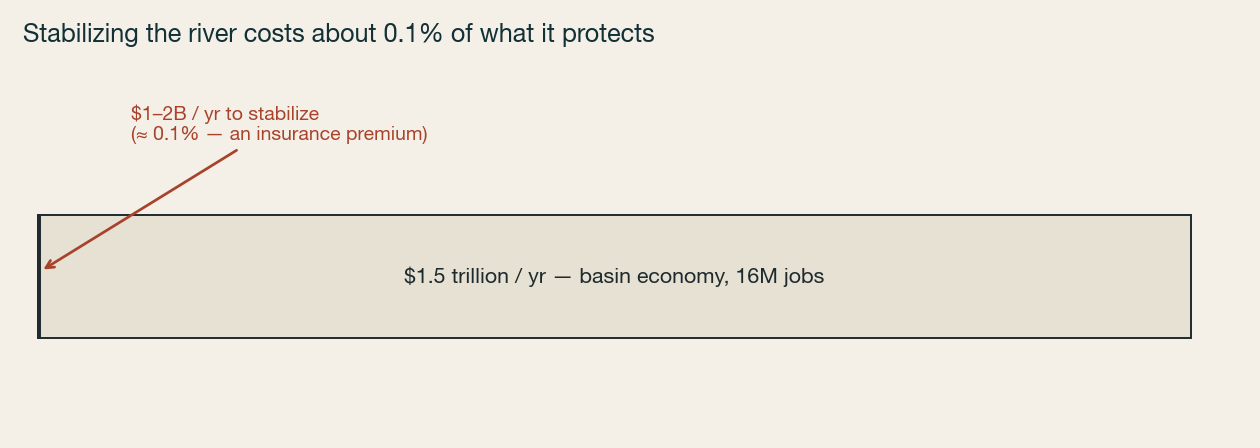
That makes the economics easier to see. Stabilizing the river is cheap protection on a huge asset. The basin generates roughly $1.5 trillion each year. Even a large intervention is a tiny share of that value, far less than one percent. The cost of acting is small compared with the cost of letting the system keep eroding. Click to enlarge
Policy reform
The old prior-appropriation rule, especially the logic behind "use it or lose it," punishes saving water. A durable fix needs return-flow protection and legal shepherding so conserved water really makes it to Mead and Powell. It also needs an accounting rule that credits verified new supply, including reuse and desal. The post-2026 renegotiation is the opening to write those rules into practice.
Tribal water
Thirty tribes hold often-senior rights, but many are still unquantified or not fully delivered. A durable fix means quantifying those rights, funding the infrastructure to move water where it is needed, and giving tribes a real seat in the decisions. The 2022 CRIT off-reservation leasing authority is the working template for how this can be done.
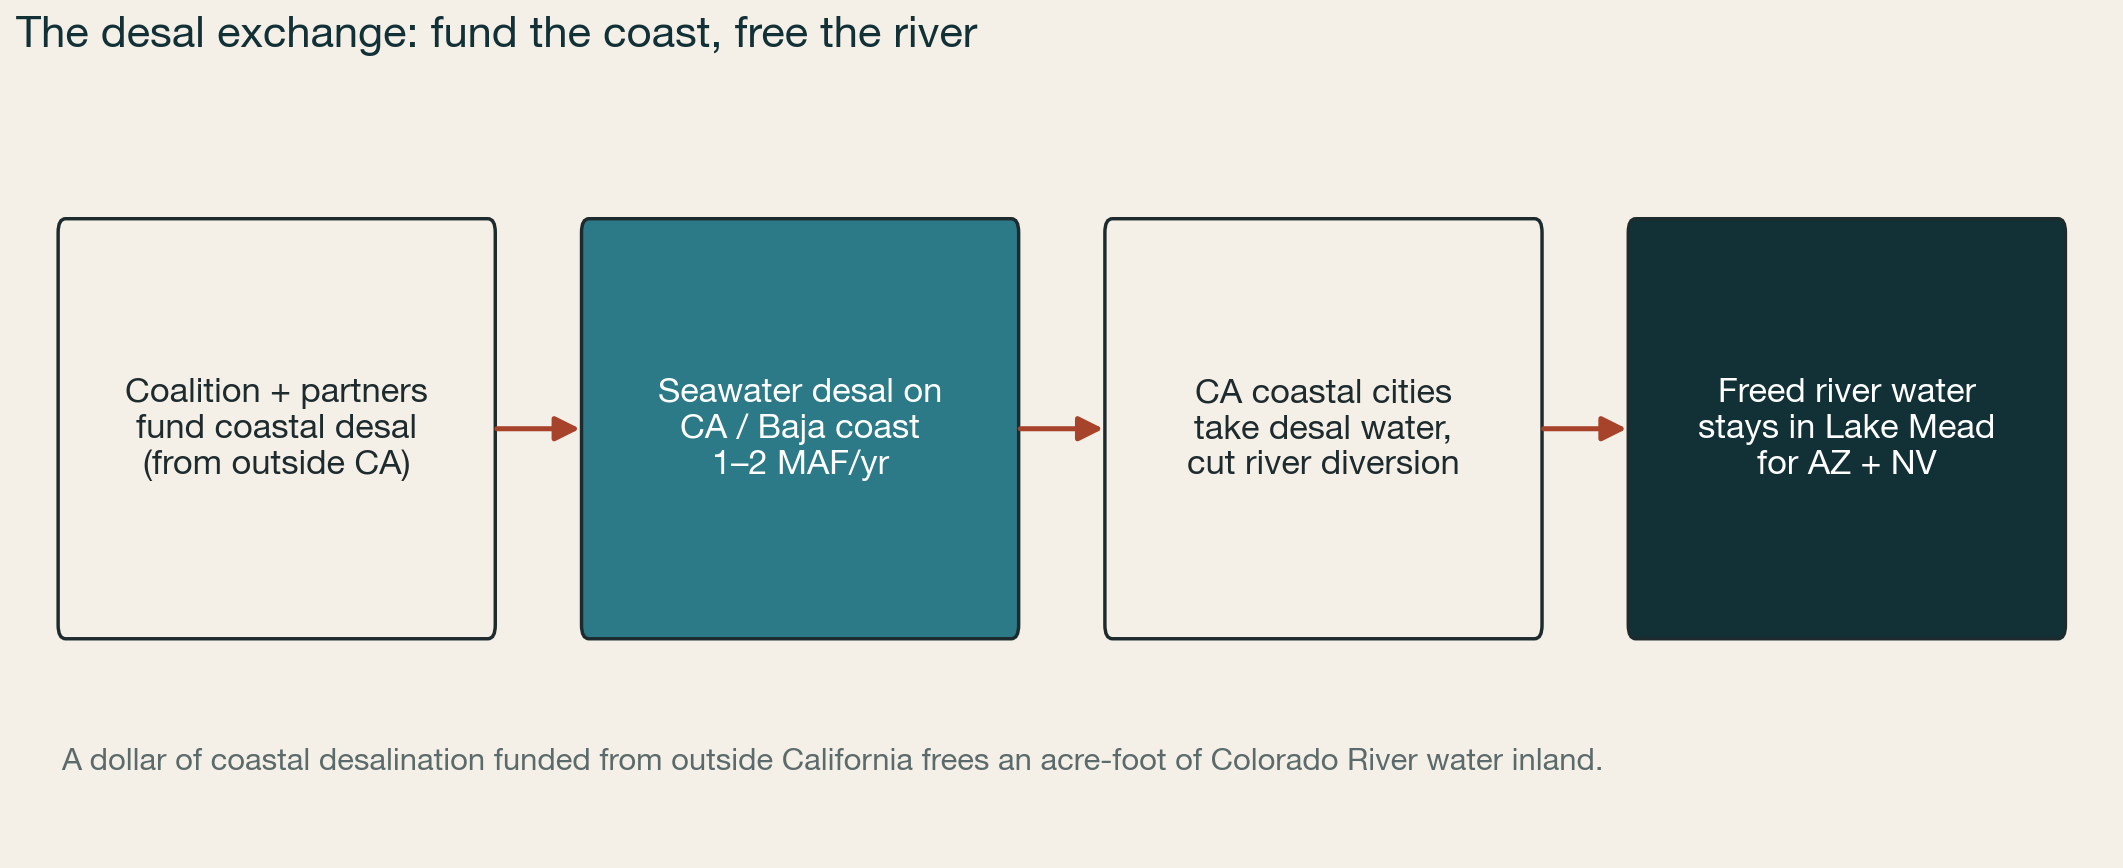
One important exchange sits at the edge of the basin. Coastal California or Baja desalination can be funded partly from outside California, while coastal cities take desal water and leave their Colorado River share in Lake Mead for Arizona and Nevada. In June 2026, Reclamation and the Arizona, California, and Nevada agencies signed an MOU that sets up this paper transfer framework, with no new inland pipeline needed. Costs run about $2,000 to $3,500 per acre-foot. The realistic path starts near 10,000 acre-feet, can scale toward about 100,000, and Kloos argues it could eventually reach 1 to 2 MAF at full scale [20]. That makes it a natural fit for outside capital, including a corporate coalition. Click to enlarge
Great Salt Lake as a testbed. Utah has a faster-moving, single-state setting next door. It is already trying compensated leasing, shepherding, turf replacement, and return-flow protection. That makes it a useful testbed for how parts of this basin strategy might work in practice. It is not yet a proof.
What could break this. The 4 MAF target may be politically out of reach. Some levers may be dead on arrival. Desal can fail under financing, energy, and permitting limits. Tribal delivery can stall. Policy reform may not happen in time. We stress-tested all of it, and the full teardown is in our honest-odds review.
Interactive · build the portfolio
Build your own path to stabilization
Move the sliders. Each lever frees water at a different cost. Watch the total against the deficit and Kloos’s ~4 MAF stabilization target, the annual cost, and the insurance premium against the basin’s $1.5 trillion economy.
0deficit ~1.5 MAF~4 MAF stabilization target
0
MAF/yr freed or made
$0
annual cost
0%
of the $1.5T basin economy
$0
blended $/AF
Cheap conservation gets you to the deficit near a 0.1% premium. Leaning on reuse and desal buys more water but costs more. That tradeoff is the whole design problem.
Ten solutions · each under $50B
The menu, costed from real projects
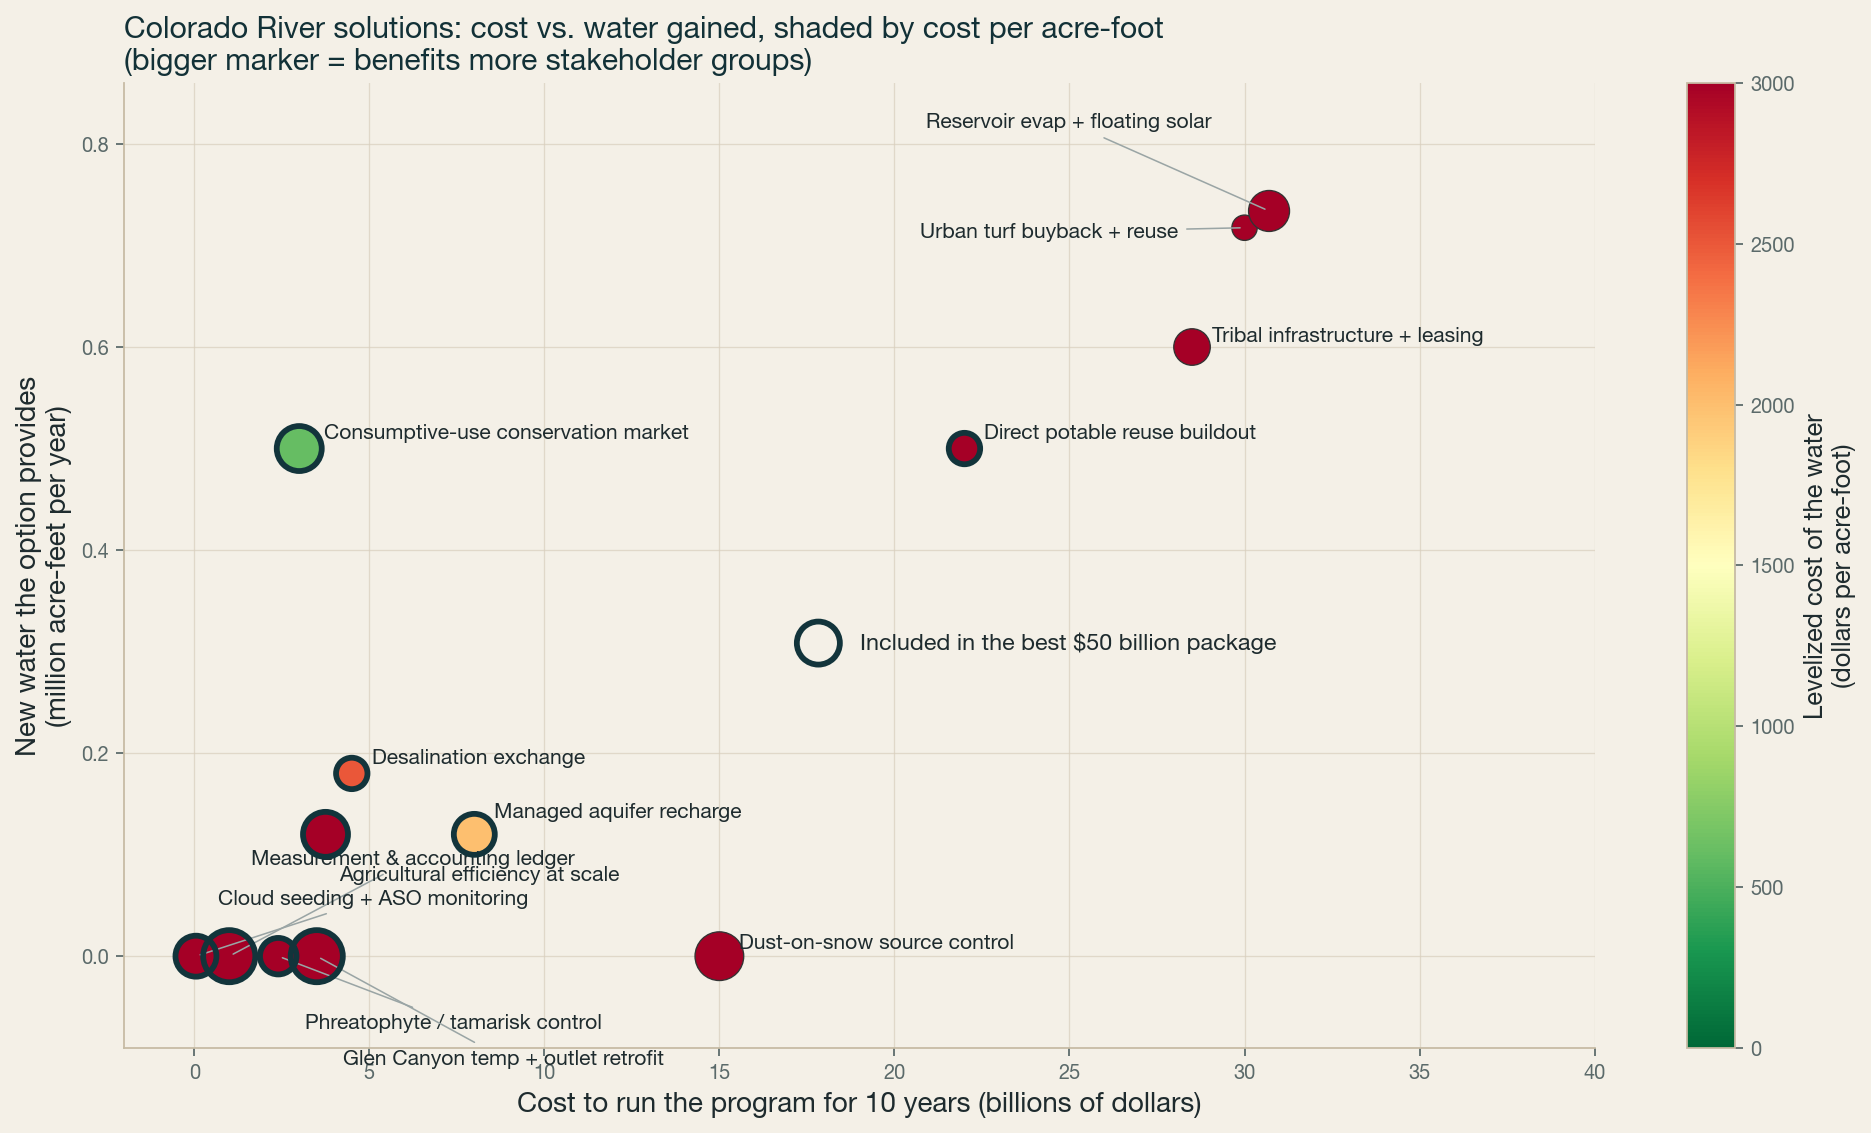
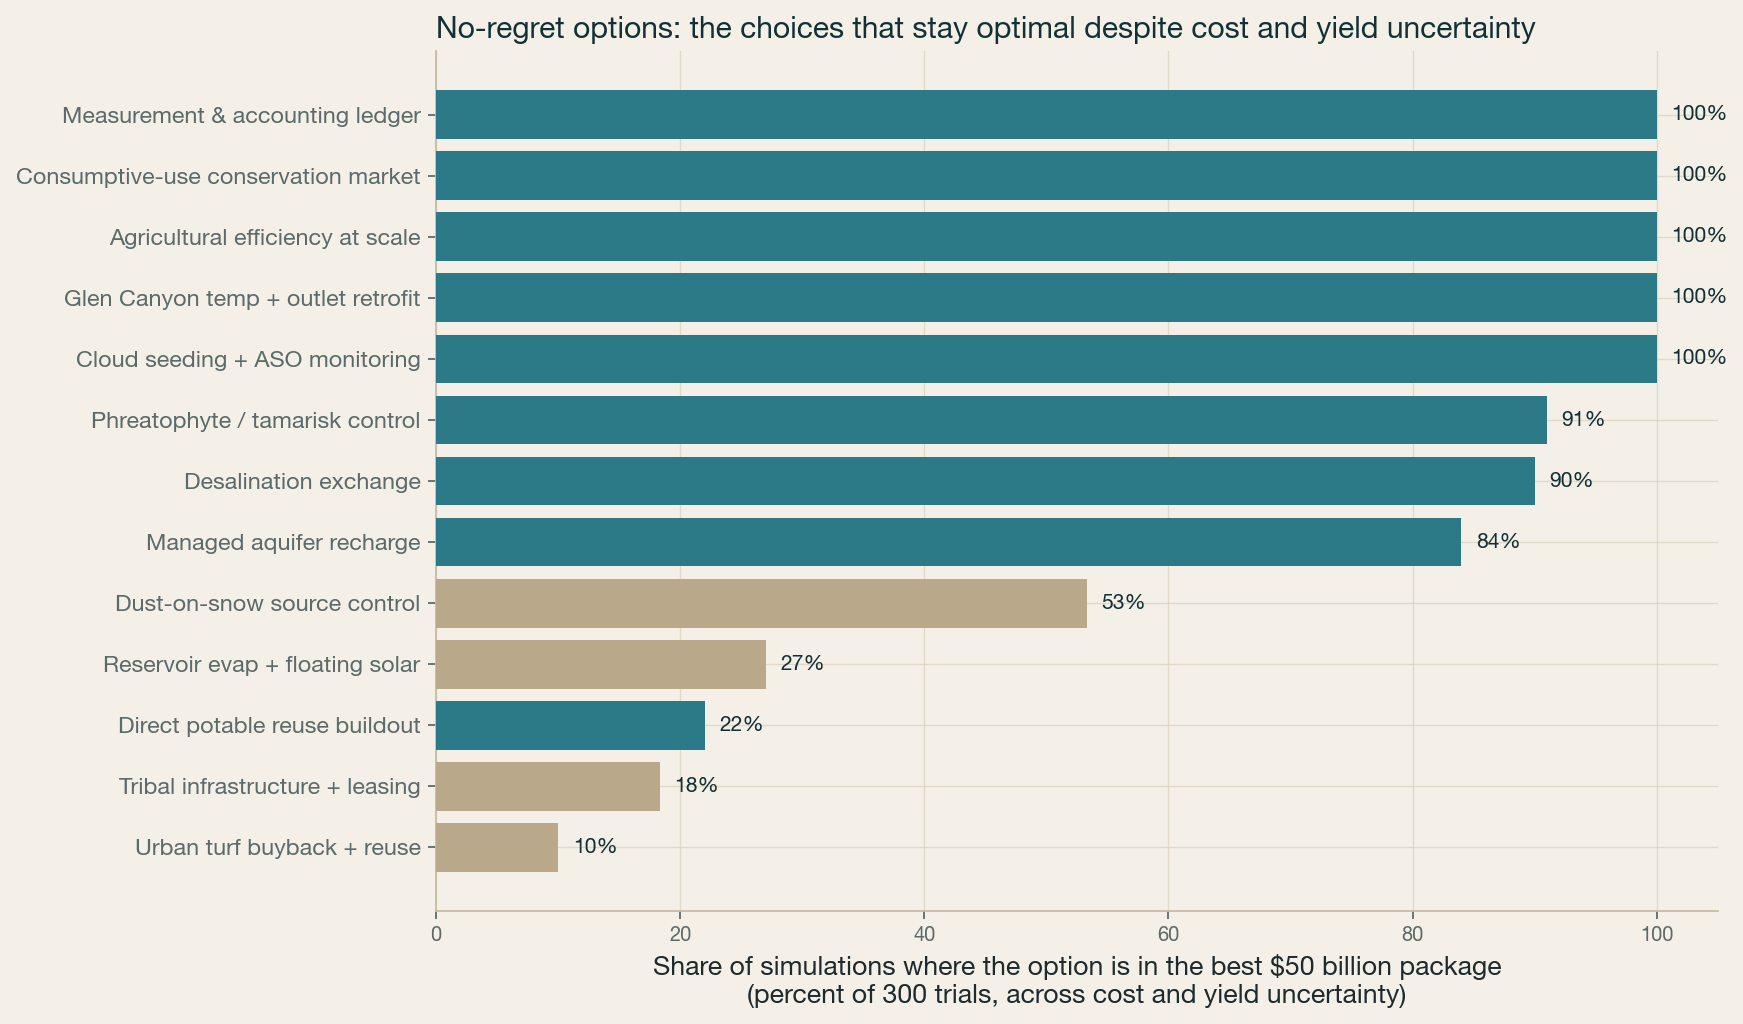
Thirteen candidates were costed from comparable projects, then modeled together as a portfolio, with a fairness constraint across stakeholders and 300 simulated runs that vary every cost and yield. The ten strongest are below. The no-regret score is the plain-English payoff test: how often each measure lands in the best package across those 300 runs. A high score means it is worth doing almost no matter how the future turns out.
Solution
10-yr cost
Water
$/AF
BCR
No-regret
Measurement & accounting ledger
$1B
enables the rest
n/a
enabler
100%
Consumptive-use conservation market
$3B
0.50 MAF
~$600
2.2
100%
Agricultural efficiency at scale
$3.75B
0.12 MAF
~$3,125
0.5
100%
Glen Canyon temp + outlet retrofit
$3.5B
ecology + hydropower, no new water
n/a
public good
100%
Cloud seeding + ASO monitoring
$0.05B
~0 bankable water (research)
n/a
n/a
100%
Phreatophyte / tamarisk control
$2.4B
~0 bankable water (habitat)
n/a
0.2
91%
Dust-on-snow source control
$15B
unverified
n/a
0.1
53%
Desalination exchange
$4.5B
0.18 MAF
~$2,500
0.4
90%
Managed aquifer recharge
$8B
0.40 MAF (net of ~75% recovery)
~$2,000
0.6
84%
Tribal infrastructure + leasing
$28.5B
0.60 MAF
~$4,750
0.5
18%
Cost, water, cost per acre-foot and the no-regret score are read from the portfolio model (outputs/solutions_numbers.json), not restated here: $/AF is the ten-year cost divided by ten years of annual yield, so the conservation market's $3B against 0.50 MAF a year is $600 per acre-foot delivered, not $6,000. A reviewer read it the other way, so it is spelled out. BCR (benefit-cost ratio) is carried from the costing pass, water valued at $1,500/AF, 5% discount, 30-yr [21][22]. Water is verified, additional consumptive-use reduction, not face-value diversion savings, after additionality, diversion-vs-consumptive, and a 25% uncertainty holdback. *Tamarisk and cloud seeding carry ~zero bankable water (USGS, Wyoming trials) and are funded as habitat/research grants. The Glen Canyon retrofit creates no new water. Aquifer recharge is shown net of ~75% recovery. These honest haircuts follow an adversarial technical review. Costings in the downloadable data.
The $15.7B financed package sits on that curve at about 0.67 MAF/yr. That curve comes from the portfolio model and the $15.7B from the financing model, and the two were built separately, so the placement is an interpolation across them rather than a single optimisation. Not a claim to erase a ~1.55 MAF structural deficit, a real, defensible dent in it. The defensible core is five measures: the measurement ledger, a verified consumptive-use conservation market (about $400/AF paid to users, ~$600 to $1,000 all-in with shepherding, still the cheapest supply), the genuine-consumptive slice of ag efficiency, the Glen Canyon retrofit (funded as a public good for ecology and hydropower, not water), and managed aquifer recharge for regional reserve. Tamarisk, cloud seeding, and dust-on-snow are out of the water math, the science doesn’t support banking their yield. Tribal infrastructure stays on its own equity track. These numbers survived an adversarial technical review. The earlier, larger headline did not.
Chapter 4
Energy, the ignored lever
The dams are losing power as the reservoirs fall, and the desert Southwest is short of grid. Cheap solar the hyperscalers are already building can backfill that power and make water. And yes, someone loses.
The energy–water nexus · power, the dams, and abundant solar
Energy is the lever the water fight keeps ignoring
The dams are losing power as the reservoirs fall, the desert Southwest is short of grid, and abundant solar the hyperscalers are already building can both backfill that power and manufacture water. Because water-making is a flexible load, it can chase the sun instead of paying to firm it, which is what keeps the cost down. Treat energy and water as one system and moves open up that neither side sees alone.
Why we’re not proposing floating solar
We are not proposing floating solar on Lake Mead or Lake Powell in any meaningful amount. Siting millions of panels in deep, canyon-bound reservoirs with 500-foot depths and 100-to-180-foot water-level swings runs into hard structural, anchoring, and mooring problems. And a realistic, recreation-compatible 10% coverage saves only about 60 to 75 thousand acre-feet a year per reservoir, a tiny fraction of the deficit. So we keep floating solar out of the water-conservation core.
Canal-top solar remains a pragmatic, niche alternative, such as the Gila River Indian Community's Casa Blanca canal (2024) or California's Project Nexus, which cut evaporation from the canal surface and reduce weed growth [23][24]. However, the water saved is minimal (canals are a tiny share of basin-wide evaporation), and water authorities like the Central Arizona Project have declined canal-top solar because the physical structures block crucial visual canal inspections. Floating or canal-top solar remains a minor resilience play for tribal or local canal operators, not a basin-scale solution.
Replacing lost hydropower with land-based solar and batteries
As the reservoirs fall, Hoover (2,080 → ~1,600 MW) and Glen Canyon (1,320 → ~800 MW, and it stops entirely below elevation 3,490 ft) are losing firm, cheap, dispatchable power and the grid services that come with it. Utility-scale land-based solar-plus-storage, photovoltaic panels (PV) paired with battery energy storage (BESS), is the definitive answer. By co-siting large-scale, land-based solar arrays and Battery Energy Storage Systems (BESS) co-located directly at the dams' existing transmission nodes, we can produce abundant, water-blind electricity. This reuses the dams' massive transmission lines with $0 in grid costs, fully backfills the lost hydropower, and decouples reservoir releases from peak electrical grid demands. Once solar-plus-storage carries the firm power, releases no longer have to be timed for the evening peak, allowing operators to release water purely for delivery, ecology, and downstream temperature control (the fix to the Grand Canyon bass problem) with zero power-revenue penalties.
Pumped hydro is a complement, not a substitute: it is a net energy consumer (70–80% round-trip), so it firms and shifts power but needs solar to charge it. Real proposals exist (Daybreak’s 2.2 GW Navajo Energy Storage near Powell, an LADWP project at Hoover), but open-loop designs add a new evaporating reservoir, ~3,000 acre-feet a year for a 500-acre pond, a water cost in a basin that can’t afford one. Closed-loop avoids most of that but costs more. Net: lead with PV+BESS at the dams, and use pumped hydro only closed-loop, for long-duration firming.
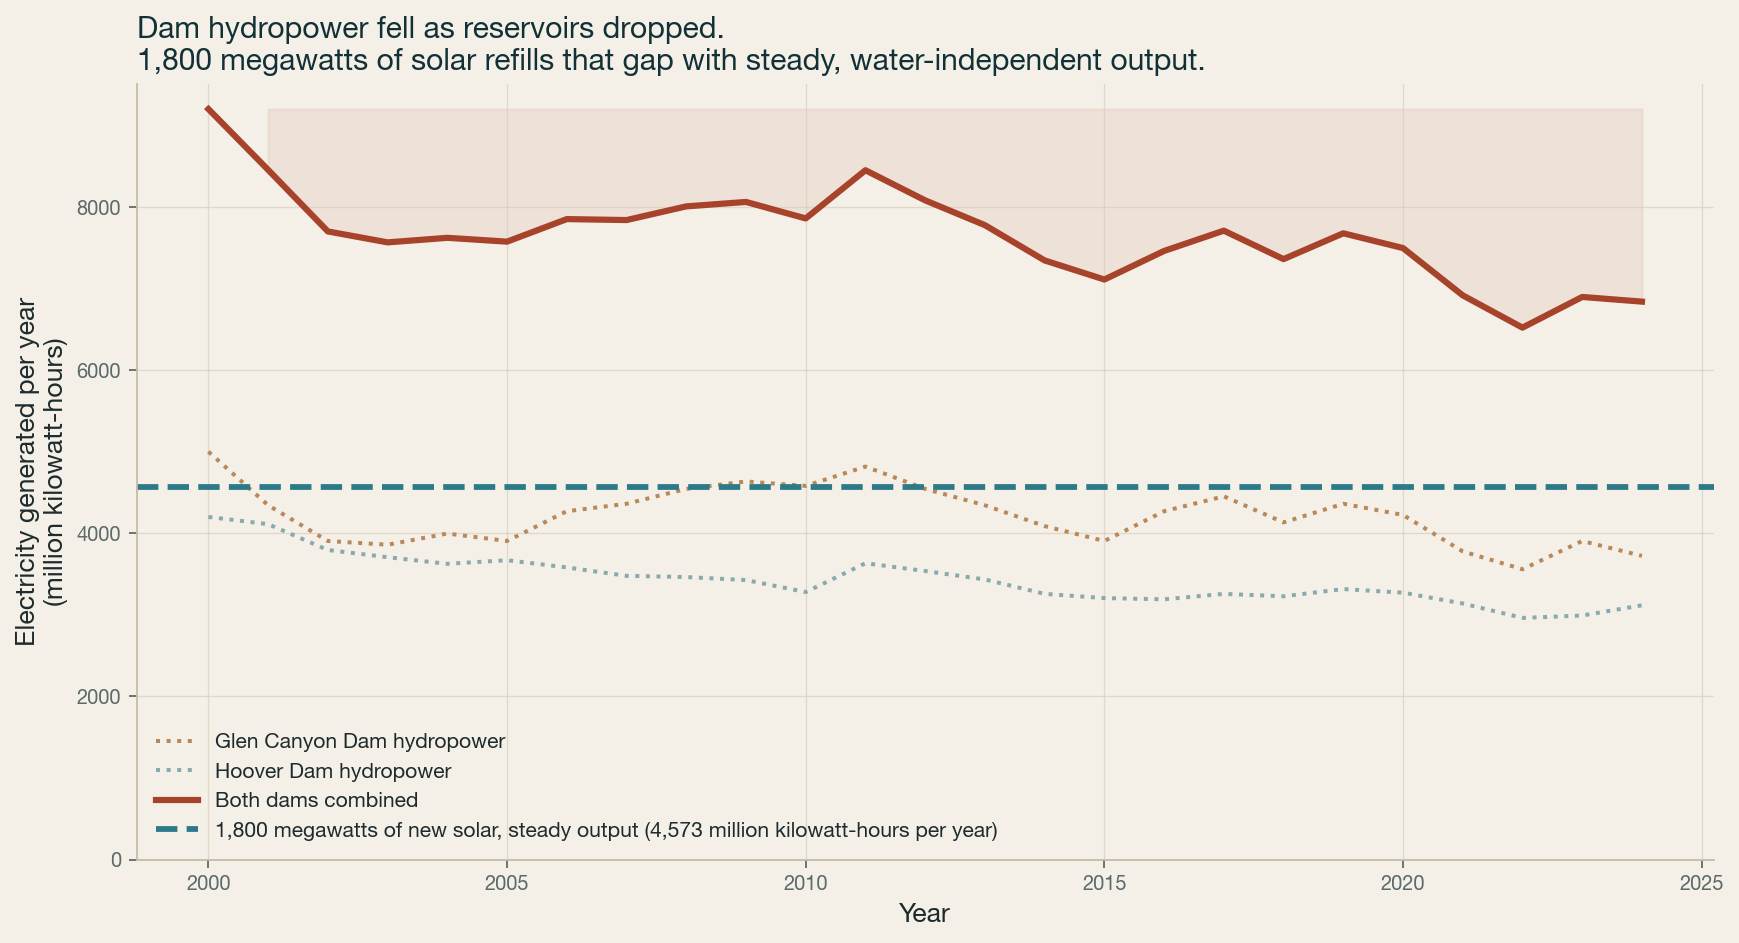
What the last 25 years would have looked like. We backtested it. Because Glen Canyon and Hoover releases are set by water-delivery law (a narrow ~7.5–8.2 MAF band), their generation fell not because less water moved but because the reservoirs dropped and the head collapsed, combined dam output is down about 26% since 2000, a cumulative ~39 TWh of lost generation. A flat 1.8 GW of PV on the dams’ existing interconnects (~4.6 TWh/yr, water-blind) would have covered that shortfall roughly 1.8× if built in 2010, displacing the market gas WAPA buys during drought (~1.8 MtCO&sub2;/yr). It would not have changed the volume released, that is fixed by delivery law, but it would have made every hard call of the drought era (steady flows for the Grand Canyon, cool-water bypass for the native fish, letting Powell fall below the power pool) a water decision instead of a power-revenue sacrifice.
Click to enlargeBacktest: dam hydropower fell with reservoir head (release stayed in its water-law band); 1.8 GW of PV backfills it flat and water-blind [25].
The transmission is not empty, and that changes the play
An early version of this work claimed ~3.5 GW of stranded transmission at the dams. An interconnection review corrected that, and we are keeping the correction visible. Here is the honest version. Hoover and Glen Canyon carry firm hydropower contracted to utilities across seven states through 2057, plus the ancillary services that keep the Southwest grid stable, so their lines are not idle. But as the reservoirs fall the dams generate less, and the region has to import replacement power [26]. Solar that backfills the lost hydropower, on the order of ~1 GW across the two dams, uses the interconnection capacity the shrinking hydro freed and cuts the imported gas. Oversize the array past the line limit and route the midday excess into storage instead of clipping it, and the battery carries it through the evening peak, the hours the strained grid needs most and exactly when the dams used to be dispatched. That part is real, though it is non-firm and six-hour storage does not cover a deep overnight or a winter lull. What is not real is the larger 3.5 GW figure, which counted capacity that is not free. Beyond the backfill, the one repurposable corridor is the retired Navajo Generating Station’s ~800 miles of 500-kV line, already contested by a 2.2 GW pumped-storage project and a 750 MW solar project and controlled by the Navajo Nation [27][28]. So the honest play is a ~1 GW backfill at the dams, plus new solar co-located with the data-center load, competing for a seat at NGS as a partner, not a discovery of empty transmission.
The regulatory key is FERC’s surplus interconnection service (Order 845): co-locate solar and storage at a derated generator’s existing interconnection and use its headroom on an expedited study, months, not the five-plus years of the standard queue, where only ~14% of projects ever finish [29]. It has been done on retiring coal (Comanche, Sherco) and gas. The catch is honest: surplus service is often non-firm (curtailed first in congestion, which the battery softens), and it needs agreements with WAPA, the Navajo Nation, and the plant’s ownership consortium.
Sized to the load, with new interconnection on a real queue
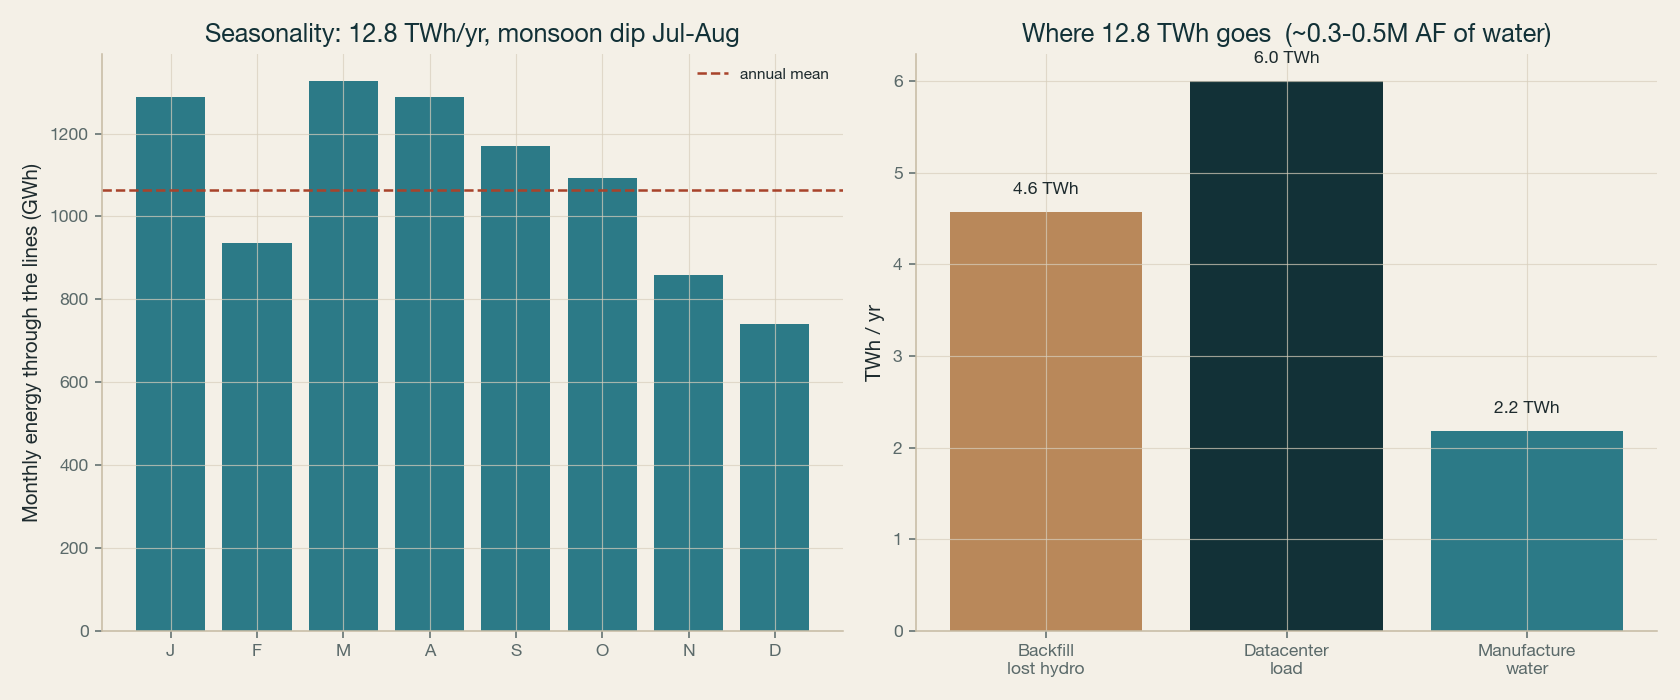
Take it as an illustration of scale, not a shovel-ready plan. A build on the order of ~5 GW of solar with six-hour storage, roughly $12B, co-located with data-center load and new or repurposed interconnection, would throw off about 13 TWh a year. That is enough to replace the dams’ fading output (~4.6 TWh), carry ~700 MW of round-the-clock data-center load, and still leave ~2.2 TWh to pump, treat, and bank water. The catch is the one the transmission review makes plain: this capacity is not sitting free on the dams’ existing lines. It needs new interconnection on a multi-year Western queue, or co-location with the load, or a negotiated partnership at the retired Navajo plant. Energy is the easy part. Grid access is the hard part [29][28].
Click to enlargeLeft: seasonality, May–June peak, the July–August monsoon dip, December trough. Right: where the 13 TWh goes.
Seasonality is the catch, and water is the answer. Desert solar runs ~34% capacity in June and ~13% in December, and batteries smooth the day but not the season. Flexible water loads, aquifer recharge, CAP pumping into Lake Pleasant, groundwater and desalination that can ramp, soak up the summer surplus and bank it underground as water, covering the winter dip that no battery can. Water infrastructure becomes the seasonal store [30][31].
And it lands where it’s needed most. The Navajo Generating Station’s 2019 closure cost the Navajo Nation ~$40M a year and up to 80% of the Hopi general fund, and ~800–1,000 coal jobs. Rebuilding on their own transmission, on the already-disturbed mine and plant land, which sidesteps the desert-tortoise conflict and earns the IRA “energy community” 10% bonus, turns a stranded coal asset into ~28,000 construction jobs, tens of millions a year in tribal revenue, and ~5 MtCO&sub2; avoided [27][32].
And the same abundant solar can make water
Abundant carbon-free PV is not only a power source, it is a water source, water and energy substitute at the margin, and in the desert the sun is the cheap input. One gigawatt of desert PV can desalinate on the order of 876,000 acre-feet of brackish or drainage water a year (~2,500 kWh/AF), and at ~$0.10/kWh the energy cost of reuse or brackish desal falls to ~$100–250/AF [31][30][33]. Ranked by water per unit of cheap energy:
Brackish groundwater desal (AZ: 530–700M AF in place)
650–2,600
adds
100s of k AF/yr
Potable reuse
1,000–2,500
adds local supply
city-scale
Seawater desal on the coast, exchanged for river water
3,700–7,400
frees river water
100–800k AF/yr
Put together, solar-powered desalination, reuse, and drainage treatment could add or free 0.3–0.5 MAF a year, the same order as the whole conservation program, with energy as the input instead of someone’s forgone water. Brine disposal is the binding inland constraint. The coastal exchange sidesteps it but needs interstate and binational deals. The binding constraints are permitting and brine disposal, not energy, and the credible near-term number is far smaller than the long-run ceiling (see the engineering reality). This is the thread that ties the hyperscalers’ energy build-out to the basin’s water: the PV they need for their own load, on transmission that already exists, throws off cheap power that backfills the dams, frees their operation for temperature and ecology, and manufactures water.
The biggest drought-proof source is the water we already threw away
The flagship use of firm solar-plus-storage is wastewater reuse and aquifer recharge, the Orange County model. OCWD purifies 134,000 acre-feet a year of sewage that used to go to the ocean, recharges it into the aquifer, and delivers it cheaper than imported water ($487–1,073/AF vs $1,130–1,600), and it is drought-proof, because wastewater flows whether or not it snows [34]. Scaled across the basin, a UCLA analysis finds lifting reuse to 40% would create ~900,000 AF a year of new supply and 50% would create 1.3 MAF. Metropolitan’s Pure Water Southern California alone targets 168,000 AF [35]. The honest catch: net-new counts only where effluent is currently discharged, Southern California’s ocean outfalls are the prize. Las Vegas already credits its return flow to Lake Mead and Phoenix already recycles 97%.
As a portfolio, the surplus energy buys a credible 1.5–3 MAF a year of new-or-saved water: reuse-to-recharge (firm power), plus cheap flexible wins that barely touch the surplus, precision and deficit irrigation (a 26–65% cut on the 70–80% of water agriculture uses, often at a net energy saving), aquifer storage and recovery (Arizona’s water bank already holds 4.4M AF of credits), and AI leak detection. Energy stops being the limit. Capture infrastructure, capital, and brine are.
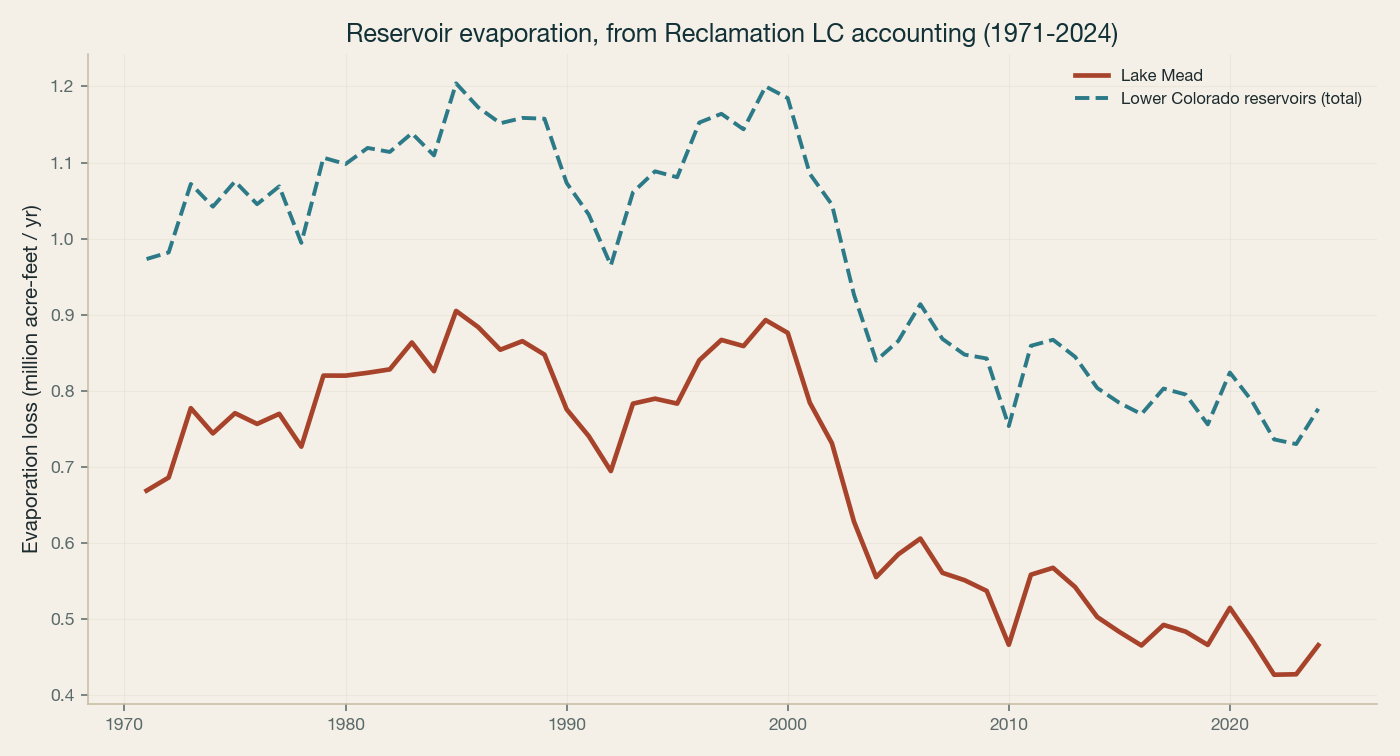
Click to enlargeReservoir evaporation, authoritative from Reclamation’s Lower Colorado accounting (1971–2024). Per-reservoir loss falls as surface area shrinks with the drought, Lake Mead ~876k AF in 2000, ~466k in 2024 [17][36].
The cost of water · every option on one axis
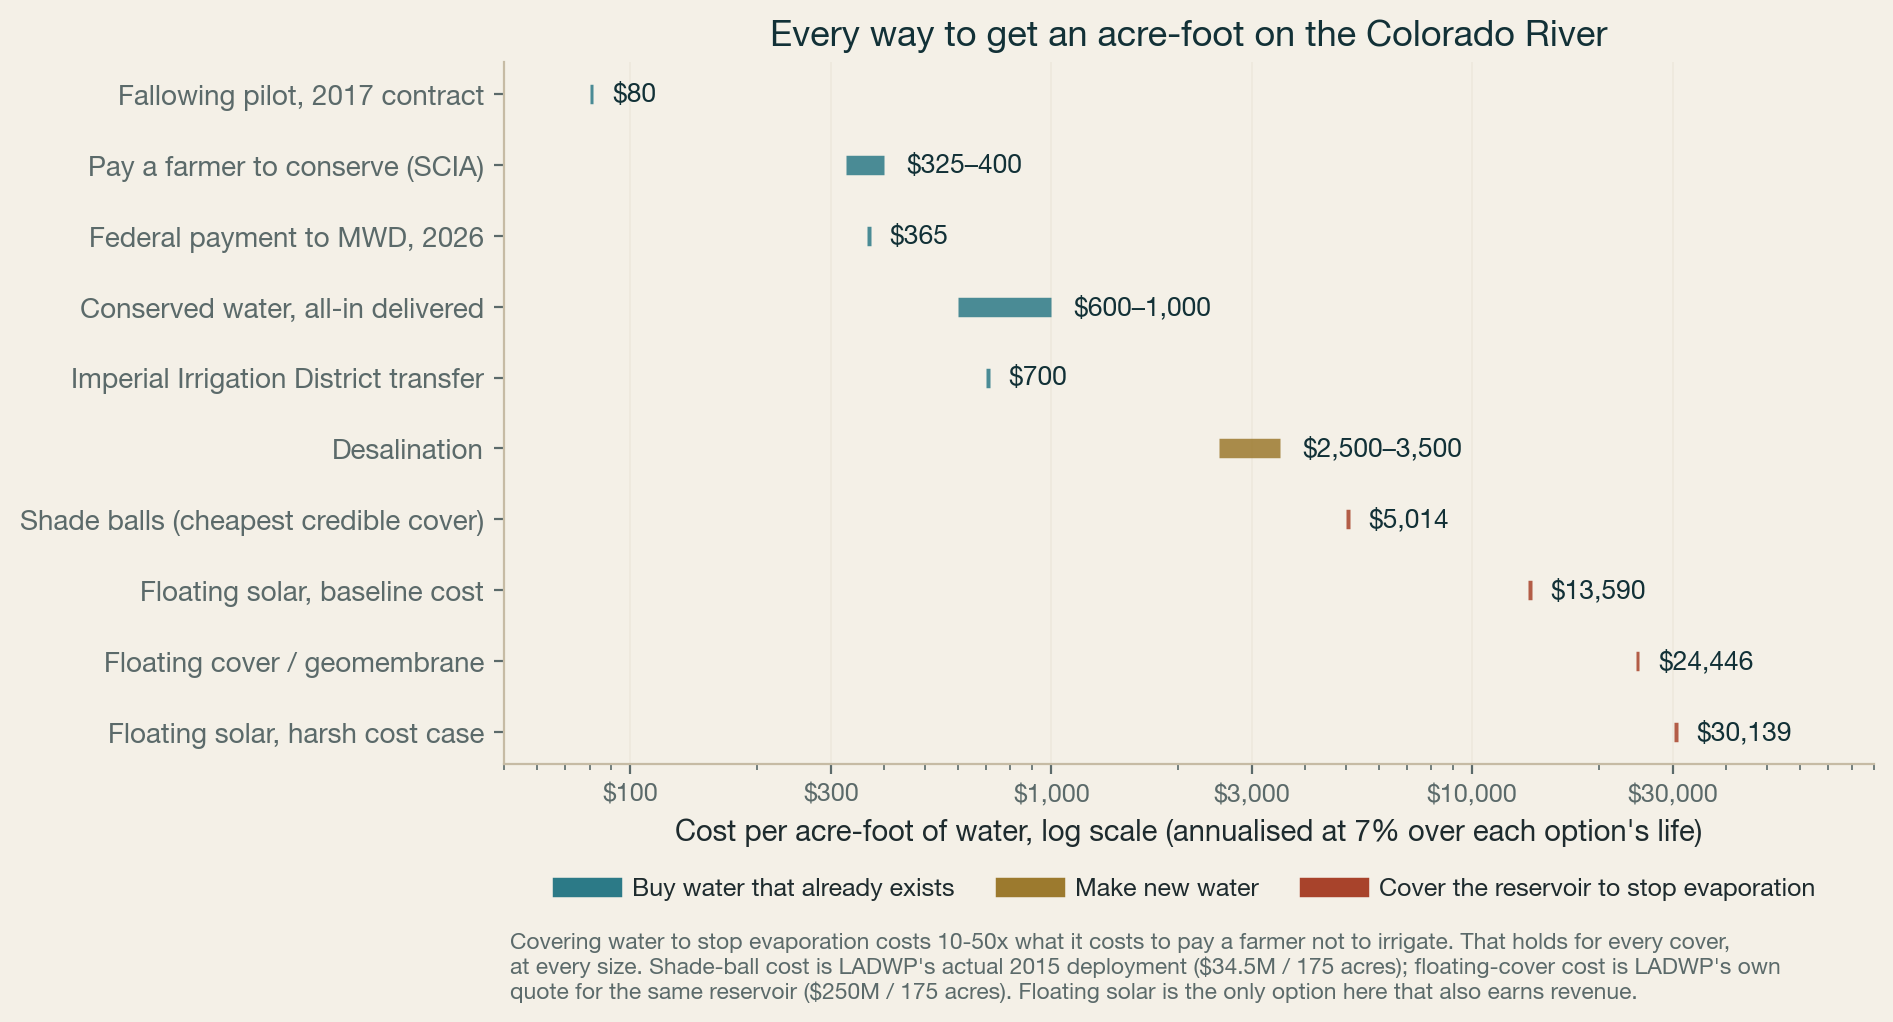
Covering a reservoir is the most expensive water on the river
Covering reservoirs to stop evaporation keeps coming up, usually as floating solar: shade the water,
make clean power, solve two problems at once. On the water it does not work. Covering water to stop it
evaporating costs ten to fifty times what it costs to pay a farmer not to irrigate — whichever
cover you choose, at whatever size.
Click to enlargeEvery option annualised at 7% over its own service life, so a ten-year shade ball and a
twenty-five-year solar array are comparable. Cover costs are anchored to real deployments: the shade-ball
figure is LADWP’s actual 2015 project ($34.5M over 175 acres) and the floating-cover figure is
LADWP’s own quote for the same reservoir ($250M over 175 acres).
The surprise in that chart is desalination. Desal is the expensive option in every water
conversation, and it still beats every reservoir cover. The reason is areal productivity, and it is worth
stating because it generalises. A cover’s yield is capped by physics: an acre of covered water
saves only what would have evaporated off it, about 6.3 acre-feet a year in the Lower Basin, and no
engineering improves that. A desalination plant has no such ceiling — Carlsbad produces roughly 56,000
acre-feet a year from a footprint of a few acres, on the order of a thousand times more water per acre.
Covers spread industrial capital cost across enormous areas to harvest a thin layer. That is the whole
story, and it is why the category loses.
What this means for floating solar. It is not the cheapest way to stop evaporation and should not
be argued as one. Its case rests on the energy — specifically on backfilling the hydropower the basin
is losing as the reservoirs fall, which is a different and stronger argument than midday solar — with
suppressed evaporation as a co-benefit that rides along.
Where basin capital can actually go → The same chart read as
an allocation question: which of these can carry capital, which cannot, and why the answer turns on who
is allowed to own the water rather than on what it costs.
Explore it yourself → Pick a reservoir, drag a
coverage slider, and watch the water saved and the sellable energy come apart. Seven reservoirs, real
shorelines, hour by hour.
Who loses · name them, or be ambushed
A plan this big makes losers. Here are ours.
Every acre-foot and megawatt this creates is revenue someone else used to earn. A proposal that hides that gets killed by the people it surprised, so we name them, and mark who becomes a partner.
Who loses
How
How much
Convert to partner?
Gas peaker plants
solar+storage takes the evening peak they exist for
AZ ~16 peakers (11 units <3% capacity factor), NV 5, already barely run
solar “capture ratios” fall. Midday prices go toward zero
BESS + flexible water loads soak the glut
Remaining coal
pushed off the dispatch stack
Four Corners 1,540 MW, Springerville 1,766 MW, already retiring 2027–32
already dying
Utilities’ new gas
stranded-asset risk
SRP +2,000 MW, TEP +400 MW of planned gas
redirect that capex into PV+BESS
Imported-water wholesalers
local reuse/desal shrinks their sales
MWD FY24 ~$429M shortfall, lowest sales since the 1940s. CAP owes $55–59M/yr regardless
bring in as offtakers
Senior ag rights (IID)
new supply erodes the scarcity value of their water
IID earns ~$194–280M/yr selling conserved water to cities
paradox: also the top conservation winner, deal design decides
Other solar developers
surplus interconnection jumps the queue
2,000+ GW stuck in 3–7 yr interconnection queues
phased allocation
Fossil workers & communities
plant closures cut jobs and the tax base
Cholla, Springerville, Four Corners/Navajo
the just-transition build is the answer
Seat them, or they fund the opposition
The genuine losers are merchant gas peakers and gas suppliers, that is the political opposition to plan for. The utilities (APS, SRP, NV Energy, TEP) own the transmission and can build the solar, so they flip from opponents to partners. The water incumbents (MWD, CAP, IID) can be offtakers and conservation sellers, or, left out, the fiercest resistance, because their business models run on scarcity. Whoever is not at the table funds the campaign against it.
New · the documented record
Where does everyone at that table actually stand, and what does the water actually trade for? We pulled the receipts: real transaction prices and formal post-2026 positions, straight from board packets and USBR scoping letters, every row linked to its source. It pairs with the stakeholder map.
What it returns, how it holds up under a stress test, who has already tried pieces of it, and the coalition that could actually build it.
The opportunity · what actually pays
Who actually pays for a plan this big
The number is what scares people, so start here. Nobody writes a $100 billion check. That figure is the whole build, and most of it is private capital already committed to data centers and the power to run them. What the basin itself has to fund, the water, is a small slice, and it runs on instruments cities use every week. Here is the stack, by who pays and with what.
Piece of the build
Who finances it
With what instrument
New money?
Data centers and the solar-plus-storage that powers them
Hyperscalers and power developers
Their own capital, power-purchase agreements, federal clean-energy tax credits
Already being spent
Water reuse, aquifer recharge, desalination
Water utilities and their ratepayers
Municipal revenue bonds, WIFIA federal loans, state revolving funds
Proven market, ~$46B issued in 2025
Conservation payments to water users
Federal government and the states
Inflation Reduction Act drought funds already put ~$4B toward the Colorado
Largely appropriated
Public goods: the Glen Canyon retrofit and the measurement ledger
Federal, plus a small beneficiary assessment
Appropriations and a ~$18 per-acre-foot surcharge on a 30-year bond
The one genuinely new ask
“$100 billion” is not a bill sent to one payer. It is a stack, and every layer already has an owner with a budget and a financing tool that works. The largest layer pays for itself through power sales to buyers who are spending the money regardless. The only genuinely new ask is small, and it buys the cheap, high-integrity core.
One tier pays for itself, the rest is public goods
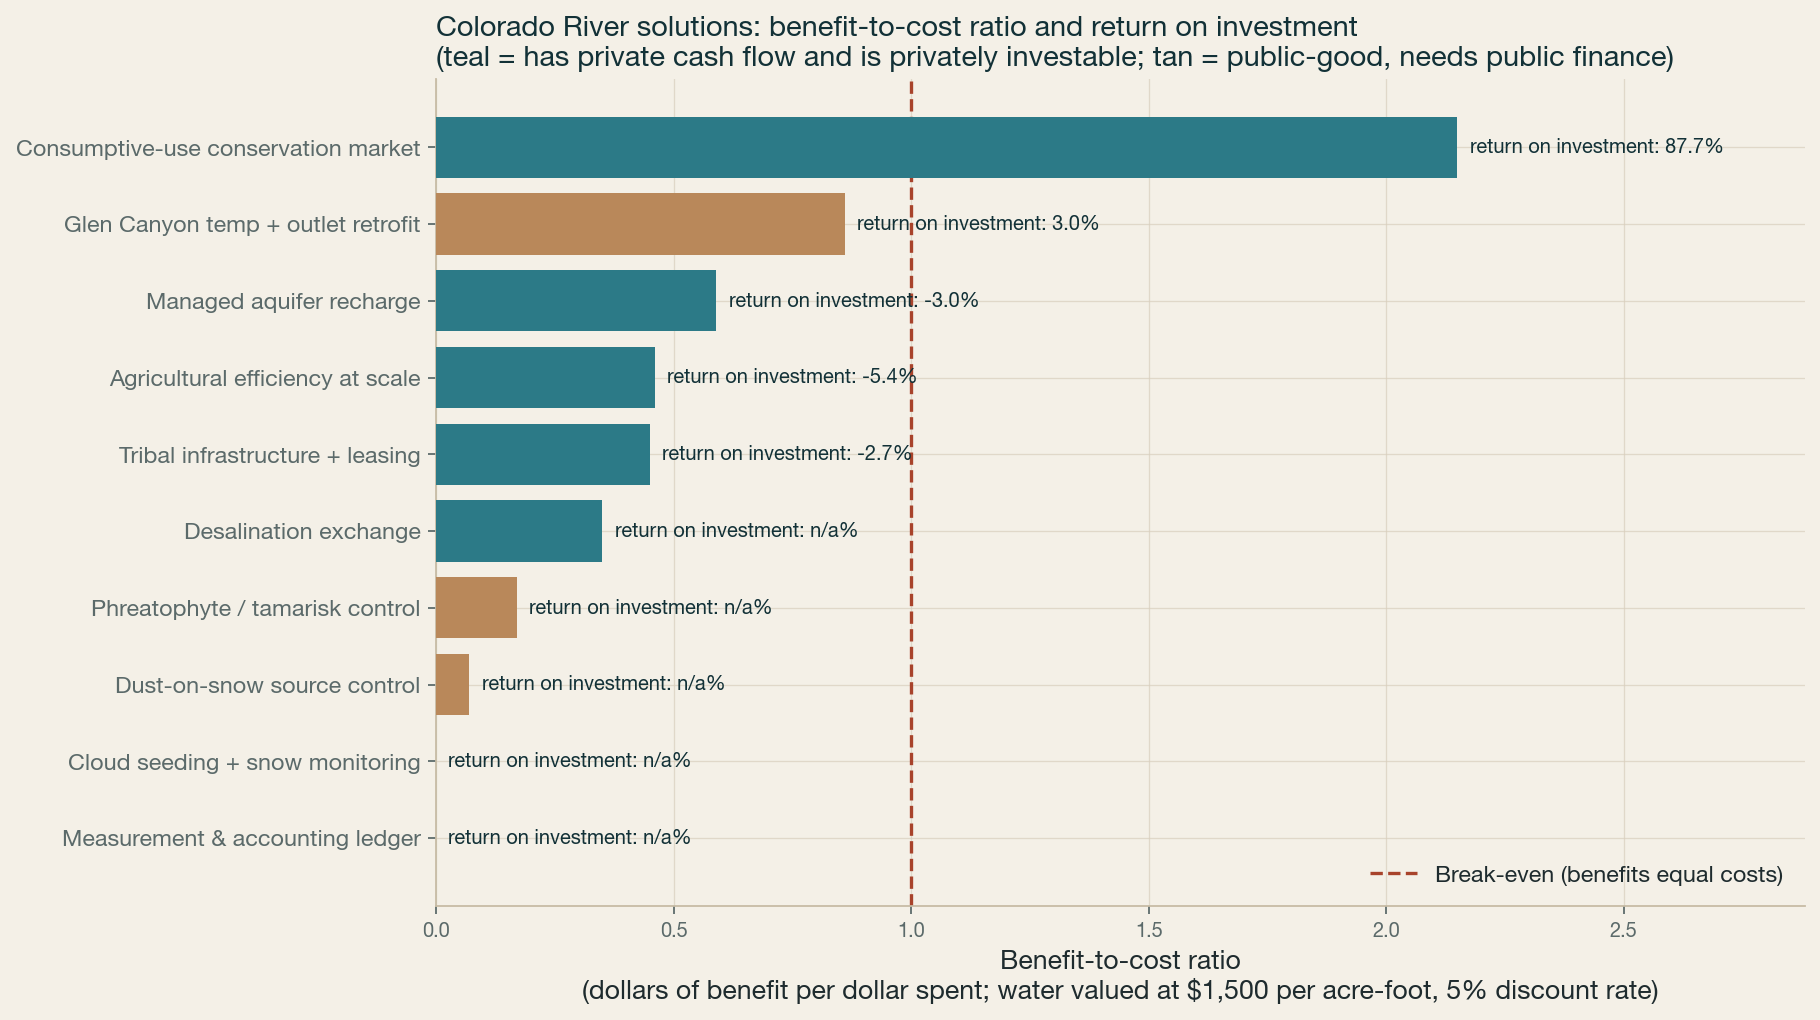
Honest finance beats a flattering headline. Conservation is the winner. The ~$400 per acre-foot recent basin deals paid is the payment to the user, not the all-in cost. With measurement, verification, and shepherding to Lake Mead, durable conserved water runs closer to $600 to $1,000 per acre-foot, still the cheapest high-integrity water in the basin, and genuinely investable if a buyer (say, a corporate replenishment commitment) anchors the offtake. The capital-heavy pieces, the Glen Canyon retrofit, aquifer recharge, ag efficiency, do not pencil as private infrastructure at any honest water value. They are public goods, and they should be funded as grants and public debt, not sold as equity promising double-digit returns. There is no 54% internal rate of return (IRR) here. There is a cheap, real conservation win and a clear-eyed public-goods bill.
Click to enlargeBenefit-cost ratio & IRR (teal = privately investable)
Can the beneficiaries finance it, not appropriations?
Partly, and here is the honest split. Of the ~$15.7B of capital, the $12.2B on revenue-capable options (metered recharge and reuse, conservation offtake, measurement fees) can service its own debt if a buyer anchors the demand. The remaining $3.5B is public goods, principally the Glen Canyon retrofit, with no cash flow, repaid by a small beneficiary assessment [37][38]:
Portion of the $15.7B capital
How it is repaid
Per-acre-foot cost
Revenue-backed, $12.2B
metered flows, conservation offtake, fees
covered
Assessment-backed, $3.5B
beneficiary surcharge on a 30-yr bond
~$18/AF
Dropping the unverified megaprojects (dust-on-snow) and pricing conservation honestly cut the beneficiary surcharge from ~$105/AF to ~$18/AF (5%, across ~13 MAF of basin use), trivial for cities (>$1,000/AF), modest for agriculture. The catch is real: even $18/AF needs an issuer with basin-wide assessment authority that does not yet exist, or a coalition that grants the public-good core outright. The instrument is proven. The governance vehicle is the gap. We do not count the water’s social value as collectible revenue.
How it actually gets financed
Not one mega-bond, but a stack of proven instruments: WIFIA federal loans cover up to 49% of eligible cost at Treasury rates, 35-year, with a 5-year repayment deferral [38]. The balance as tax-exempt revenue and assessment bonds into a US water and sewer muni market that issued $46B in 2025 alone [39]. And Environmental Impact Bonds (the DC Water model) that pay investors on verified acre-feet saved, turning the measurement ledger into the settlement layer [40]. Labeled blue bonds already raise several billion a year, so a staged Colorado River program sits well within market appetite [37].
Build your own · interactive model
Design your own package
Pick the measures, set what water is worth, the discount and bond rates, and the budget. The model recomputes water freed, returns, blue-bond coverage, and whether every stakeholder still clears, live, in your browser. Or let it optimize under your budget. This is the same model as above. Nothing leaves the page.
Water freed
–
10-yr cost
–
NPV, 30yr
–
Benefit-cost
–
Bond surcharge
–
Bond coverage
–
Additive water credits new supply / demand reduction / avoided loss in full, storage at a third, keystones (measurement, Glen Canyon) at zero acre-feet. Stakeholder floor = each of seven groups clears a minimum benefit score. Bond = package capital. Surcharge spread across ~13 MAF of basin use.
Stress test · and the cost of inaction
It holds under pressure. Inaction costs far more.
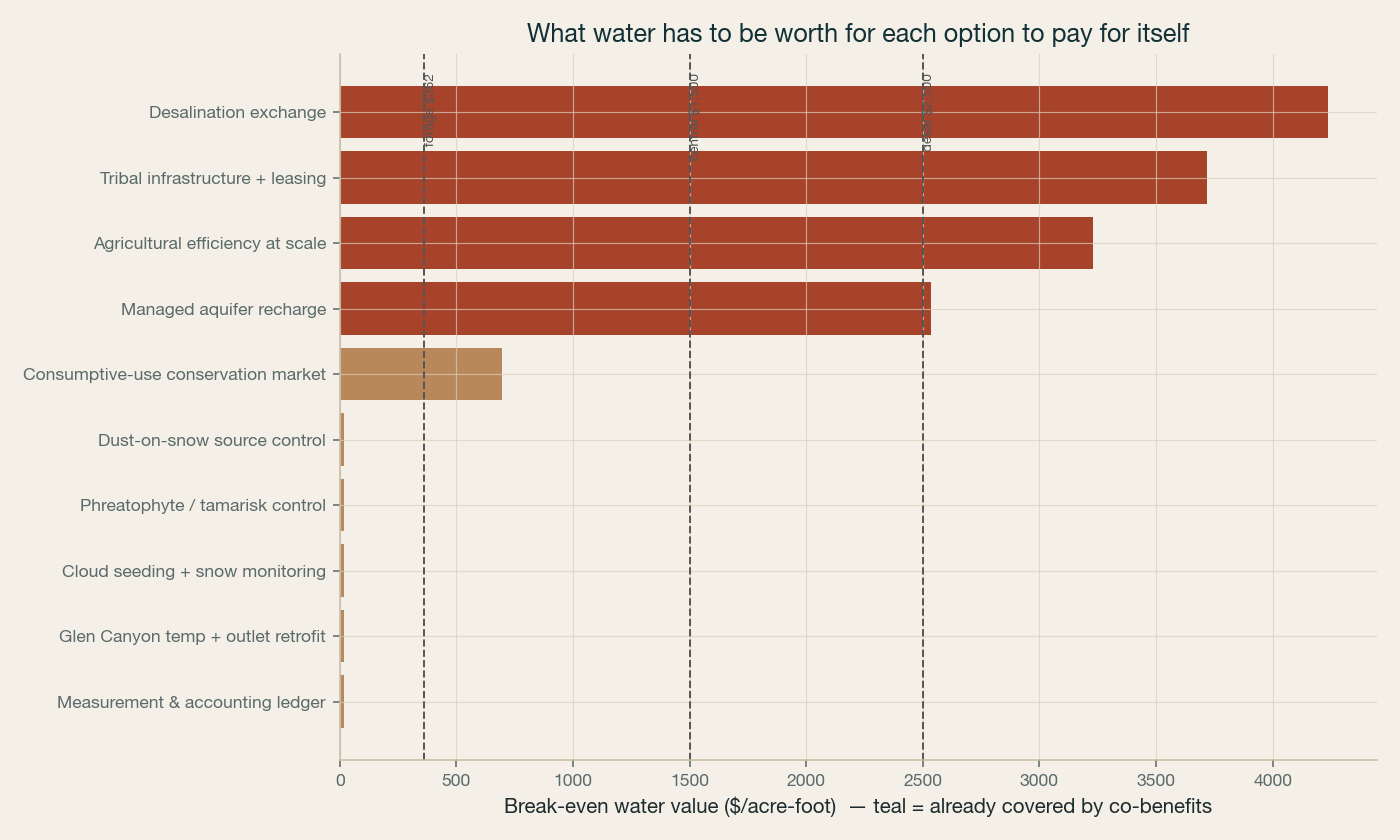
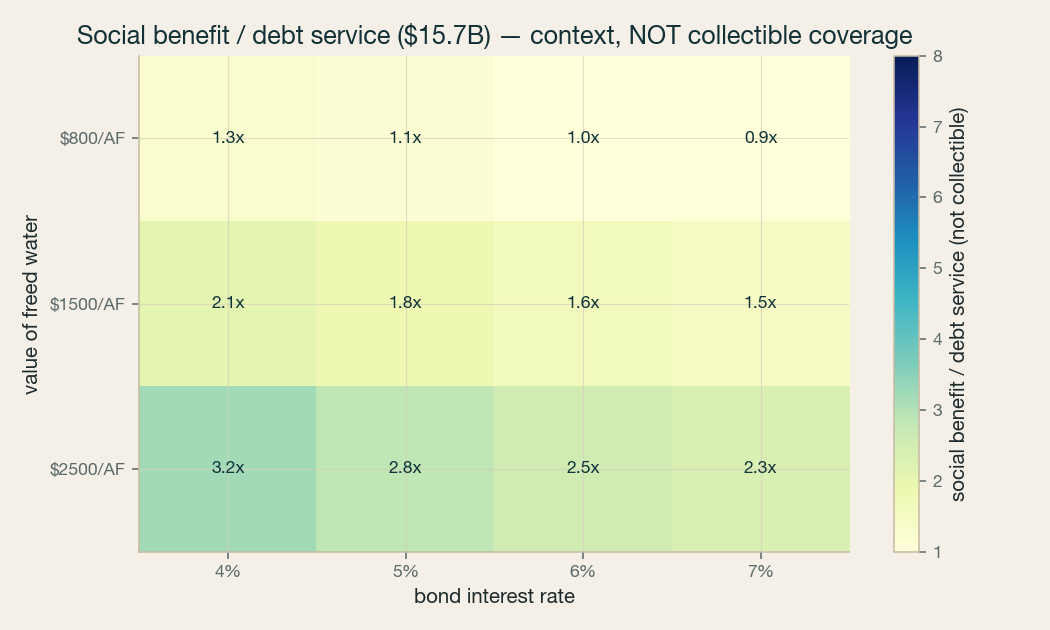
A grounded adversarial review refereed every cost and yield against comparable projects and the primary literature, and forced real cuts (see how the numbers changed below). What survives is robust: the conservation tier stays benefit-cost positive even at a pessimistic $800/AF and a 7% discount, because at ~$400/AF it beats every alternative supply. The capital-heavy public goods do not clear a water-only test at any rate, their justification is avoided cost of inaction, not private return. (Model results on grounded cost priors, not audited estimates. Class 4/5 engineering estimates are the next step.)
Click to enlargeWhat water must be worth for each option to pay for itselfClick to enlargeSocial benefit vs. debt service across rate × water value, context, not collectible coverage
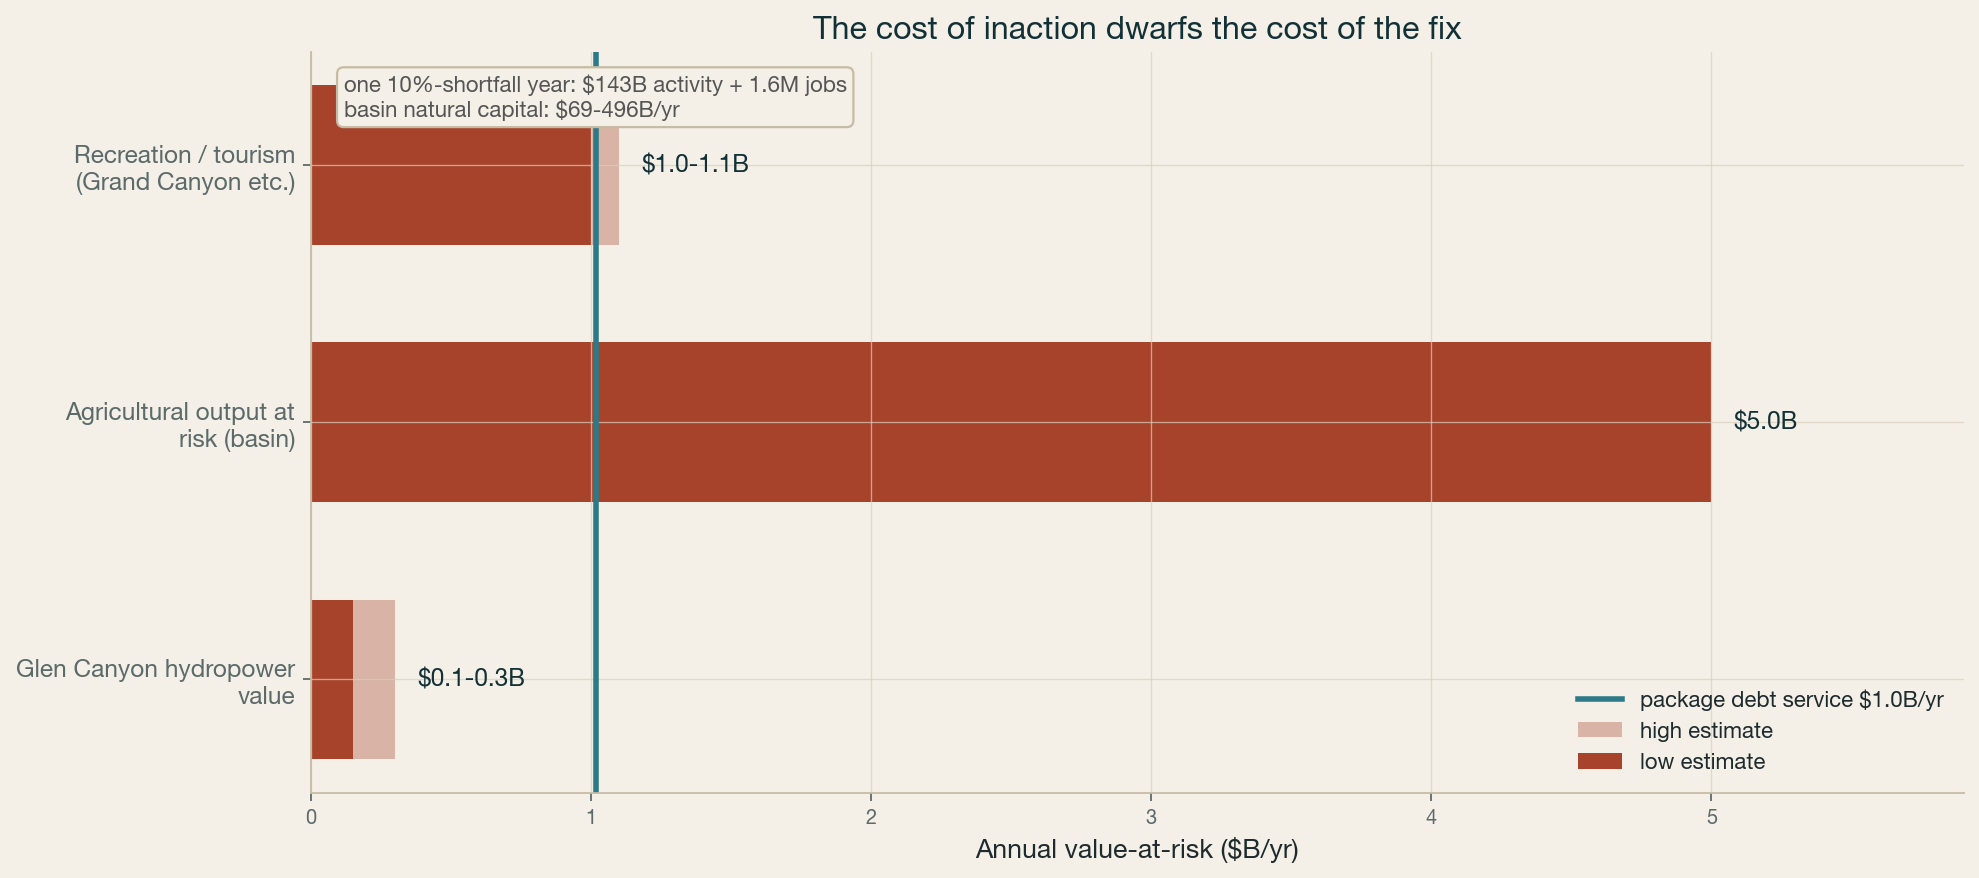
~$1.0B/yr to insure against ~$6.4B/yr, and a $143B severe year
The package’s annual debt service (~$1.0B at 5% over 30 years) is a fraction of the damages already accruing (Glen Canyon hydropower ~$0.15–0.3B/yr, agriculture ~$5B, recreation ~$1.1B [41]), and a rounding error against the ~$143B in gross economic activity and 1.6 million jobs a single 10%-shortfall year would put at risk [42]. Shortage damage is non-linear, it accelerates as cuts bite into high-value uses, so even ~1 MAF/yr of verified reduction, shepherded to storage, buffers a meaningful slice of that exposure. The case was never a high private return. It is cheap insurance on a $1.5 trillion economy.
Nearly every piece of this is already built or funded somewhere, some of it quite mature. The honest claim is not a new idea. It is the first time these pieces are assembled into one system for the Colorado River, plus one genuinely new instrument. Here is the map, with credit where it is due.
Turns a public consumptive-use dataset into a verification layer for settlement, with a 25% uncertainty holdback and shepherding, not raw ET
Credit accounting
VWBA 2.0 (WRI, LimnoTech, Bonneville) & the Gold Standard Water Benefit Standard [43]
Applies it to Colorado consumptive-use at scale, tied to reservoir delivery, not corporate reporting
Pay-for-conservation to storage
Lower Basin 2023 plan + ICS, System Conservation Pilot [44]; tribal leasing (Gila River, CRIT)
A standing market with a corporate demand anchor, not one-off, federally-funded contracts
Corporate basin money
Bonneville “Change the Course” / Business for Water Stewardship [45], Water Resilience Coalition, Walton / Water Funder Initiative
Coordinated at basin scale and pledged forward, not scattered per-company offsets
The finance
IRA Reclamation conservation funds, philanthropy
An Advance Market Commitment + blue-bond stack, a durable demand signal, not annual appropriations
The one genuinely new instrument: an Advance Market Commitment for water
Frontier put $1B+ behind future carbon removal [46]; LEAF mobilized $1.5B for forests [47]. No one has built the equivalent forward-purchase commitment for water, not on the Colorado, not anywhere. That demand signal is the piece that turns a patchwork of pilots into a market. Everything else here already works in fragments. This is what connects them.
Two things we are not pretending, 1. Shepherding
Saved water is not yet legally protected downstream to Lake Powell, “conservation pools” are proposed but unbuilt, and need unanimous state agreement. So this starts in the Lower Basin, where conserved water already stays in Lake Mead through the ICS mechanism. Prove it where the plumbing works, then extend.
2. The market skeptics
The basin’s largest funder, the Walton Family Foundation, has reportedly stepped back from water markets toward watershed health. The most sophisticated money has doubts. Our answer is not more enthusiasm, it is integrity (verified, additional, shepherded) plus a demand anchor that de-risks exactly the market mechanism they lost faith in.
The coalition · who must move
The Grand Compromise: a package, not a menu
No actor can pass this alone. It works as a sequenced deal where each party contributes and each gains. Timeline: cloud seeding, conservation, and ag efficiency deliver in 1–2 years, measurement in 5–7, the Glen Canyon retrofit is the 10–15 year long-pole. The critical-path bottleneck is political consensus on the interstate conservation market, and the post-2026 guidelines are the venue.
Federal (Reclamation, Interior)
Avoids systemic collapse, endless litigation, and having to impose draconian cuts unilaterally. Gets an administrable long-term framework.
gives: funding + authority
Lower Basin cities & ag
Cities get reliability without $2,500/AF desal. Farmers get paid for measured savings and keep the value through leasing rather than losing it to a mandated cut.
gives: measured conservation
Upper Basin states
Evaporation finally booked, a Compact Call averted, and cloud-seeding + measurement investment aimed at their headwaters.
gives: participation, not a blank check
Tribes
Full parties to the measurement ledger, settlement infrastructure funded, and leasing authority that turns ~1 MAF of unused senior water into income.
gives: senior-right certainty
Environmental / Grand Canyon
A downstream temperature target, cool-mix flows protected, and phreatophyte restoration, the ecosystem gets a seat in the operating rules.
gives: legitimacy + science
Capital (water-tech investor lens)
The measurement, conservation-market, and efficiency layers are the high-BCR, revenue-bondable core, innovation over legacy capital, financed by a blue bond.
gives: the money, de-risked
A private-led path · faster than the compact
How capital leads while the states stay deadlocked
The interstate process owns the questions only it can answer, allocation, the Compact, environmental standards, and it is stuck. But the highest-leverage, fastest-moving pieces need no interstate consensus. Private capital can build them now and, in doing so, de-risk the public deal rather than wait for it. That is Basin 2.0’s operating model, and much of it is already underway.
Fund the measurement layer, unilaterally
A consortium can deploy satellite ET, sensors, and a public data platform without anyone’s permission. Deciding who gets charged for what the data shows is the political fight, and that still needs the states and Interior, but the instrumentation does not wait on them. The Walton Family Foundation already funds basin data, and a mature water-tech field (leak detection, smart metering, satellite ET) supplies the instrumentation. Cheapest, fastest, highest-leverage, it creates the shared truth the negotiation lacks.
deployable now
Stand up the conservation & leasing market
Willing-seller deals already work: IID and Coachella deficit-irrigation, the Jicarilla Apache Nation leasing 20,000 AF, the Ten Tribes Partnership’s water-bank push. Private capital can fund and scale these transactions between farmers, tribes, and cities today.
willing sellers, now
Aggregate corporate water demand
Microsoft (with Trout Unlimited), PepsiCo, Intel, and Coca-Cola already fund basin restoration against their footprints. A fund can aggregate these buyers into durable demand for verified acre-feet, priced through volumetric water-benefit accounting.
deep-pocketed, motivated
Finance ahead of any public issuer
Blended capital moves before a basin authority exists: impact funds, WIFIA, Environmental Impact Bonds [40], and Walton-style de-risking grants. Xylem already issued the first US corporate blue bond. The revenue-bondable core carries a real return.
yield + impact
Deploy the water-tech
On willing customers, no regulator required: Rubicon automation saved a Palo Verde farmer 43% on a field. Irrigreen and Yuma’s automated gates stretch supply. This is water-tech’s core competence, pointed at the basin.
ship it to customers
The trap to avoid
Water speculation. Greenstone’s Cibola-to-Queen Creek sale drew lawsuits. Colorado is tightening anti-speculation law. Structure everything as conservation-with-community-benefit and in genuine tribal partnership (Jicarilla, Cocopah), not extraction, or the backlash kills it.
community benefit, or bust
The move: a Basin 2.0 coalition that funds measurement, seeds the conservation market, aggregates corporate buyers, and finances the revenue core, front-running the compact and handing the states a working mechanism instead of a blank page.
The methods and assumptions, the named experts who should check it, and every source behind the numbers.
Interrogate this
Confirm it, don’t take our word
Every number here is computed from public data on public-cloud credits and checked against the literature by a grounded AI review (four of six claim clusters confirmed, precision revisions applied). It has not yet been reviewed by a named human expert, that is the next step (see reviewers below). The inputs are open:
Groundwater (M3): NASA JPL GRACE-FO mascons, PO.DAAC dataset, in line with the published ~52 km³ [7].
Method, code, costings, and the ROI / blue-bond model are public on GitHub: every analysis script, the computed numbers, the portfolio optimizer, the finance model, and a full methodology with an assumptions ledger. Clone it and run it.
Assumptions worth pressure-testing: water valued at $1,500/AF (range $800–2,500 modeled); the groundwater share is genuinely uncertain, our direct GLDAS-plus-reservoir decomposition puts it near 10–30% (reservoir drawdown dominates the visible loss) while the published literature puts it near two-thirds, and we report both rather than pick one. The GRACE basin polygon is approximate. Solution costs are grounded priors, Monte-Carlo-stressed, not engineering estimates. All are stated in the data, not hidden.
Review · who we are asking
This is AI-computed. Here is who should check it.
Every finding is traceable to public data, but an asset for researchers and policymakers needs named human expertise. We are seeking review or co-authorship from:
Expert
Affiliation
Would validate
Brad Udall
CSU Colorado Water Center
Hot-drought & evaporation (M1)
Jonathan Overpeck
University of Michigan
Aridification / climate-flow
Anne Castle
CU Getches-Wilkinson (ex-Interior)
Policy recommendations & finance
Robert Glennon
University of Arizona Law
Water markets, groundwater economics
John Fleck
University of New Mexico
Governance & economic assumptions
Stephanie Castle
UC Irvine
GRACE groundwater (M3)
Until a named expert has signed off, treat the modeled economics as exploratory. The measured findings (M1–M4) stand on their own public-data validation.
Sources
Verified references
Every link below was URL-verified July 2026. Fabricated or stale links returned by automated search were discarded during verification. A few open normally in a browser but block automated checkers.
1 Rising, Josset, Troy & Lall 2022, Global Environmental Change: infrastructure & national demand shape US water stress (AWASH). link
Big Tech is about to drop $100 billion into data centers and chip fabs across the desert Southwest. Everyone’s furious about it.
Flip it. Use that same buildout to refill the Colorado River.
The dams are losing power as the reservoirs fall, and the desert Southwest is short of grid. The hyperscalers are already building their own solar and storage to run the data centers, so site that build to do triple duty. Power for the data centers. Replacement for the fading dams. And enough surplus daytime solar left over to make water. Reuse, desalination, and recharge are flexible loads. They run when the sun is up and idle when it isn’t, so they soak up intermittent power without paying to store or firm it.
Not charity. Not offsets. A build whose biggest tier pays for itself, whose public-goods tier is priced honestly, and that makes the whole basin measurably better, acre-foot by acre-foot, in public. The companies blamed for draining the desert become the ones who refilled the river.
 Click to enlarge
 Click to enlarge
 Click to enlarge
 Click to enlarge