The Colorado River, measured from orbit
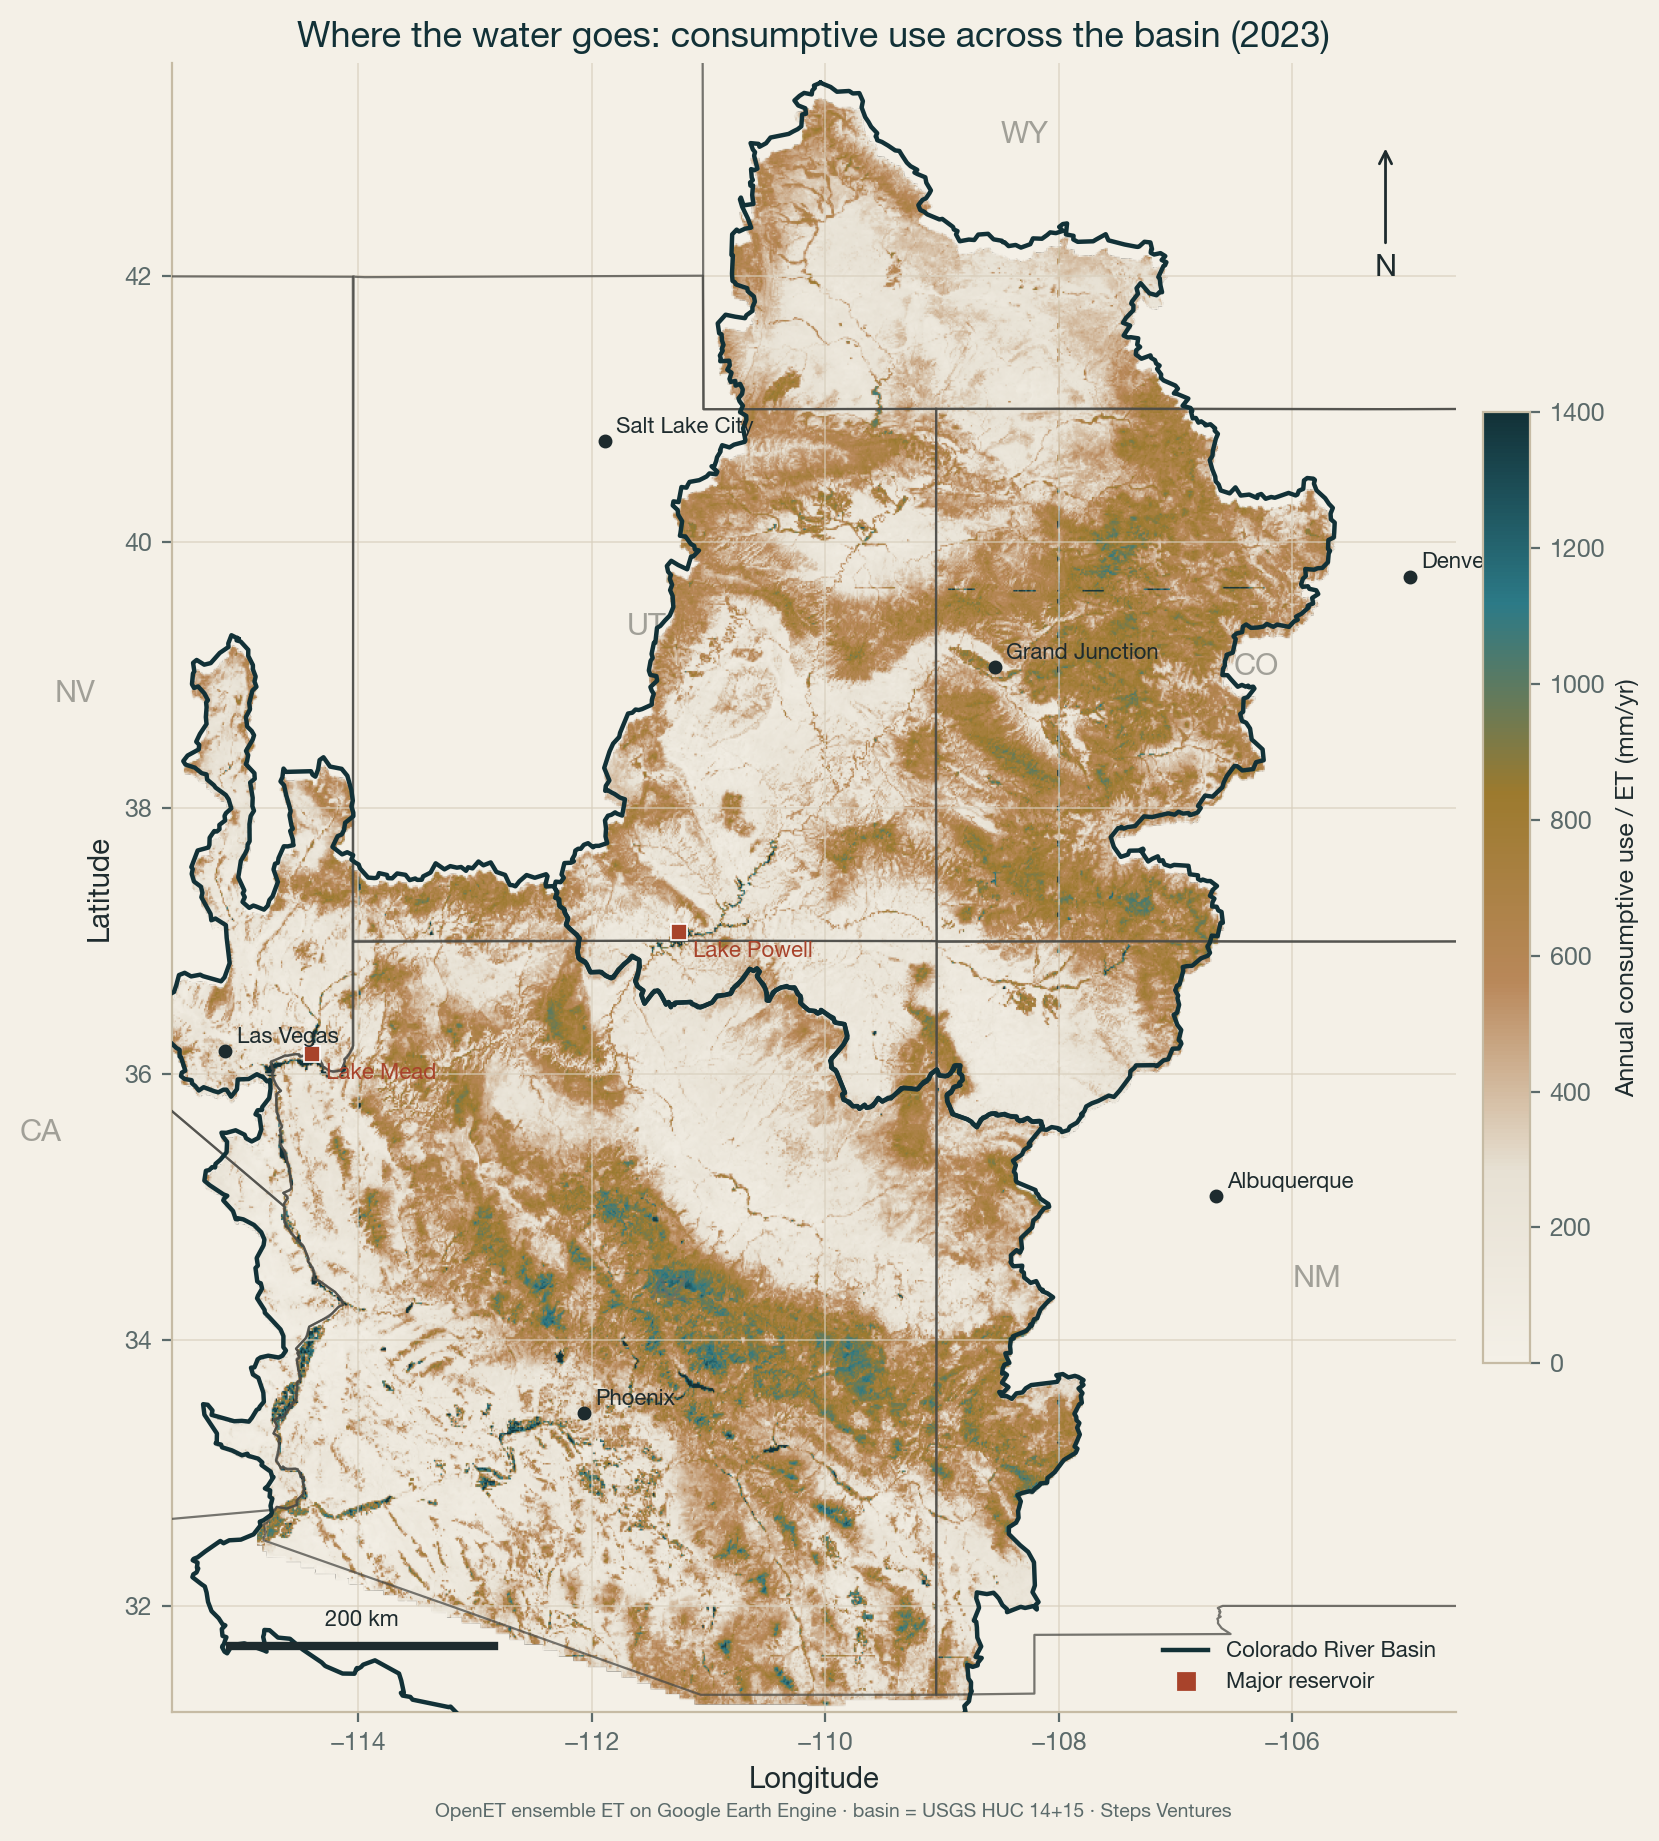
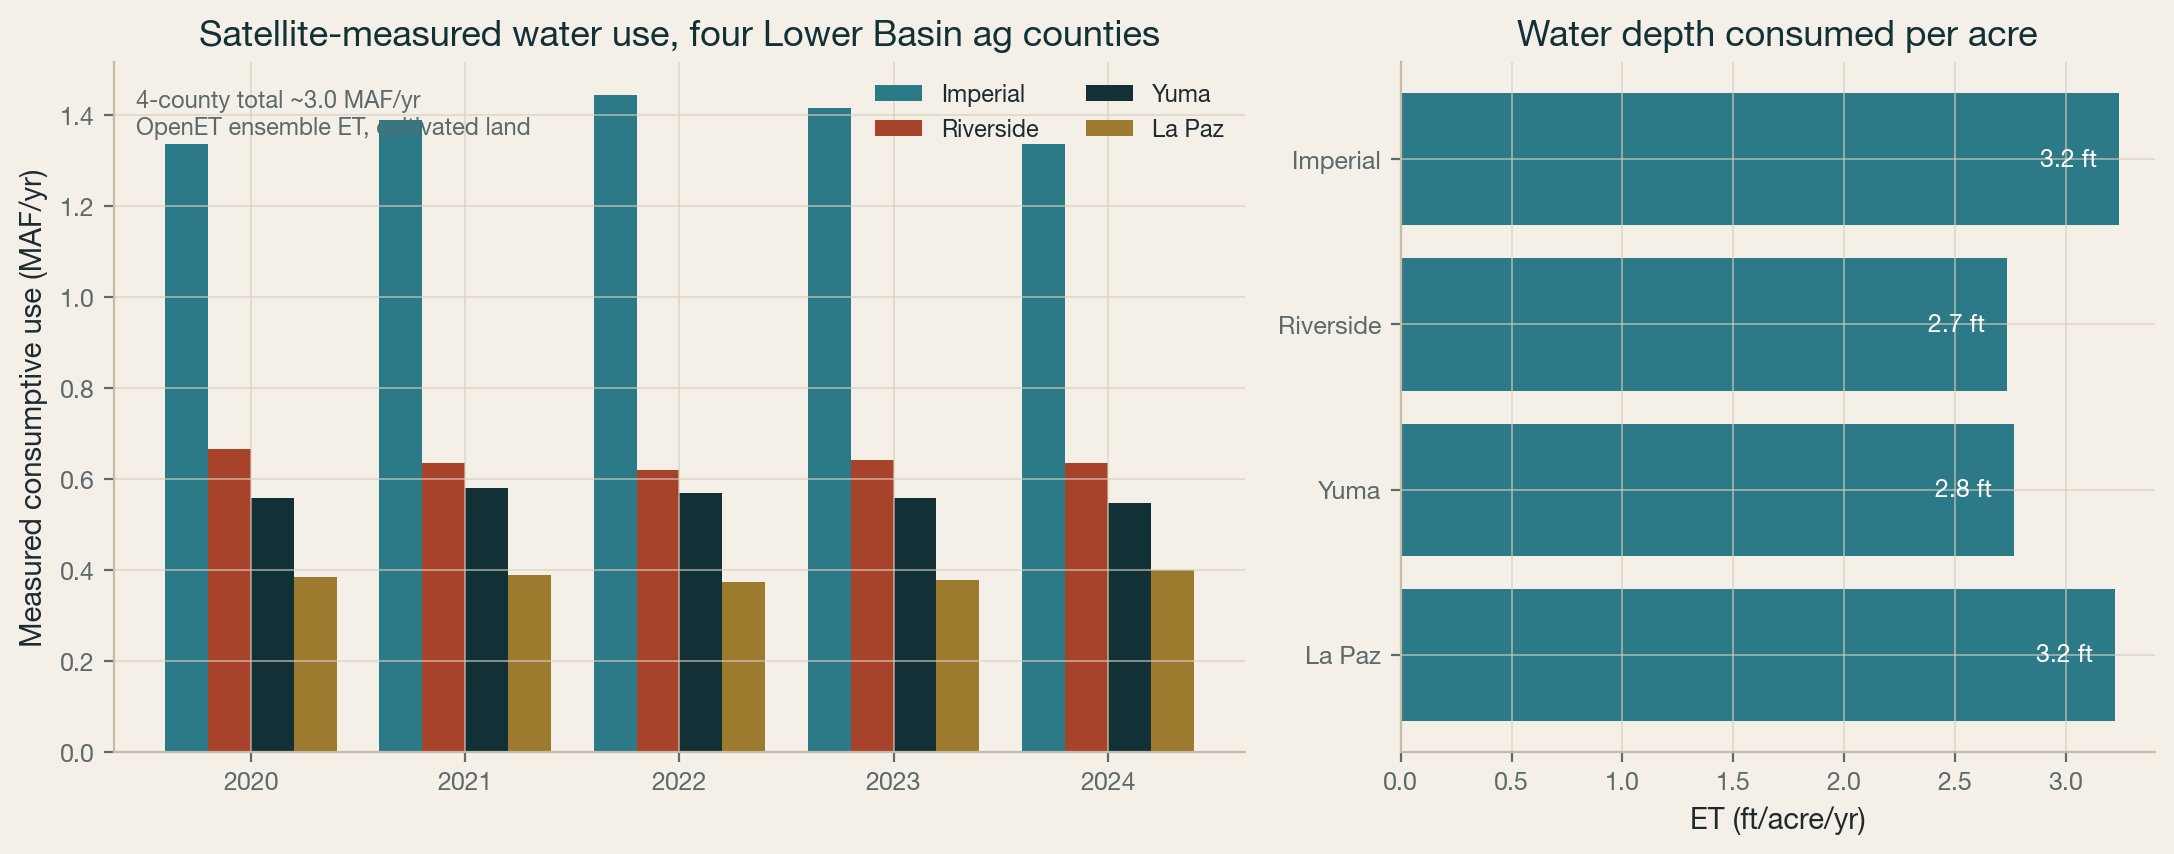
Basin 2.0 said the missing piece is verifiable water. So we measured it. The satellite figures below — consumptive use, reservoir extent, storage, snowpack — are computed on Google Earth Engine from public collections. The cost and offtake numbers around them are analysis, and labeled.
1. Where the water actually goes
 Click to enlarge
 Click to enlarge
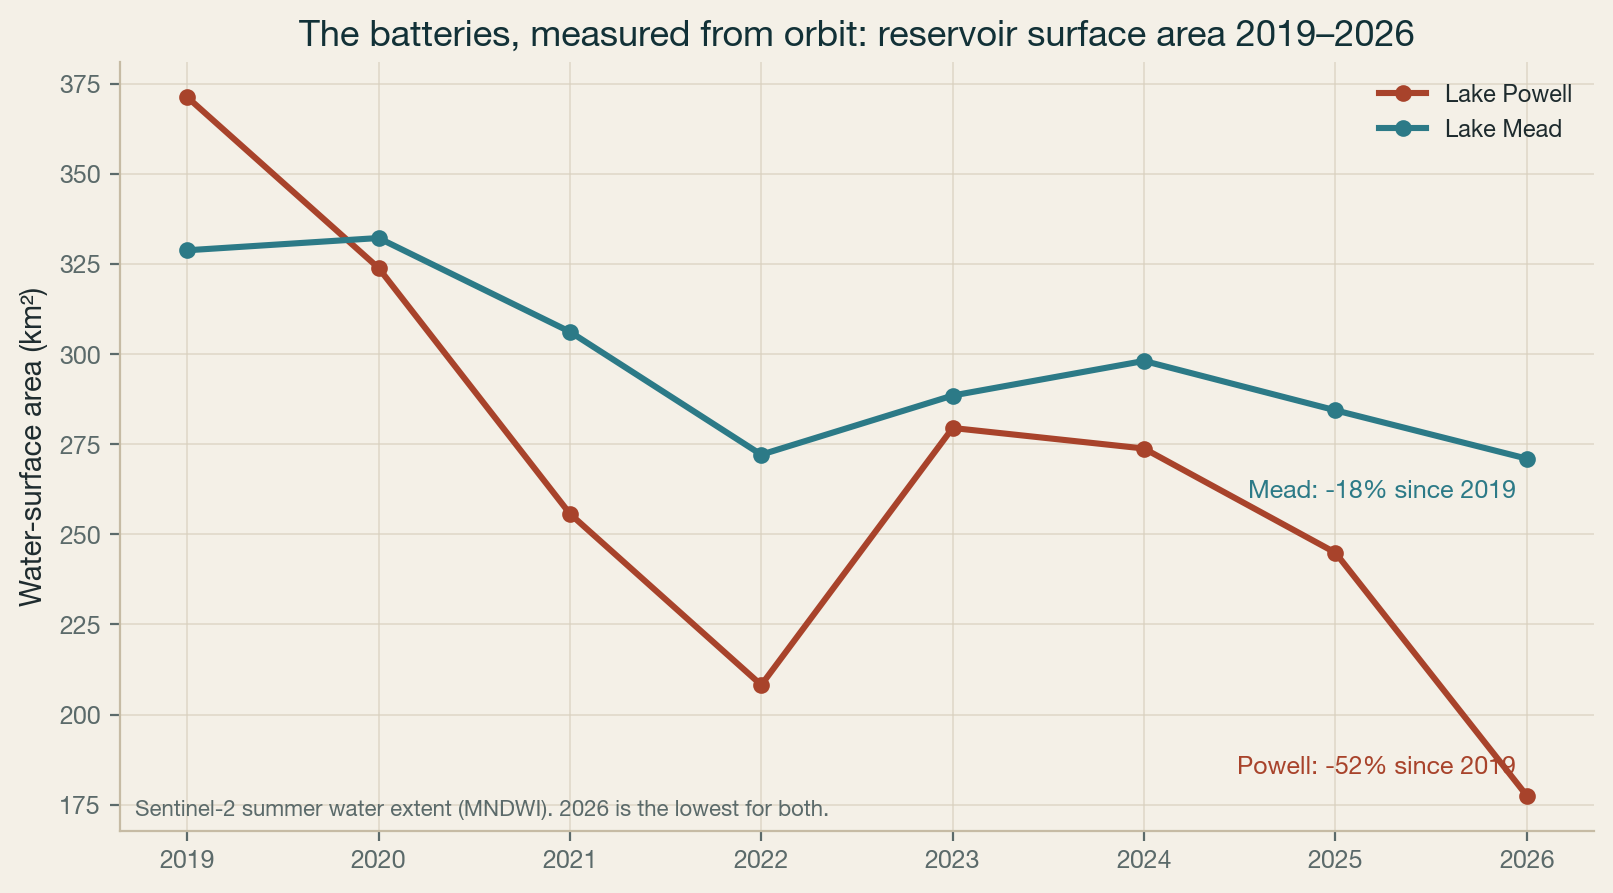
2. The batteries, measured
Standard water datasets stop in 2021. We carried the reservoirs to 2026 with Sentinel-2.
 Click to enlarge
Interactive: watch the water retreat
Drag to change the year. Blue is open water, measured from Sentinel-2.
Year:
3. Panelist ideas, pressure-tested with data
Lall — floating solar on the reservoirs
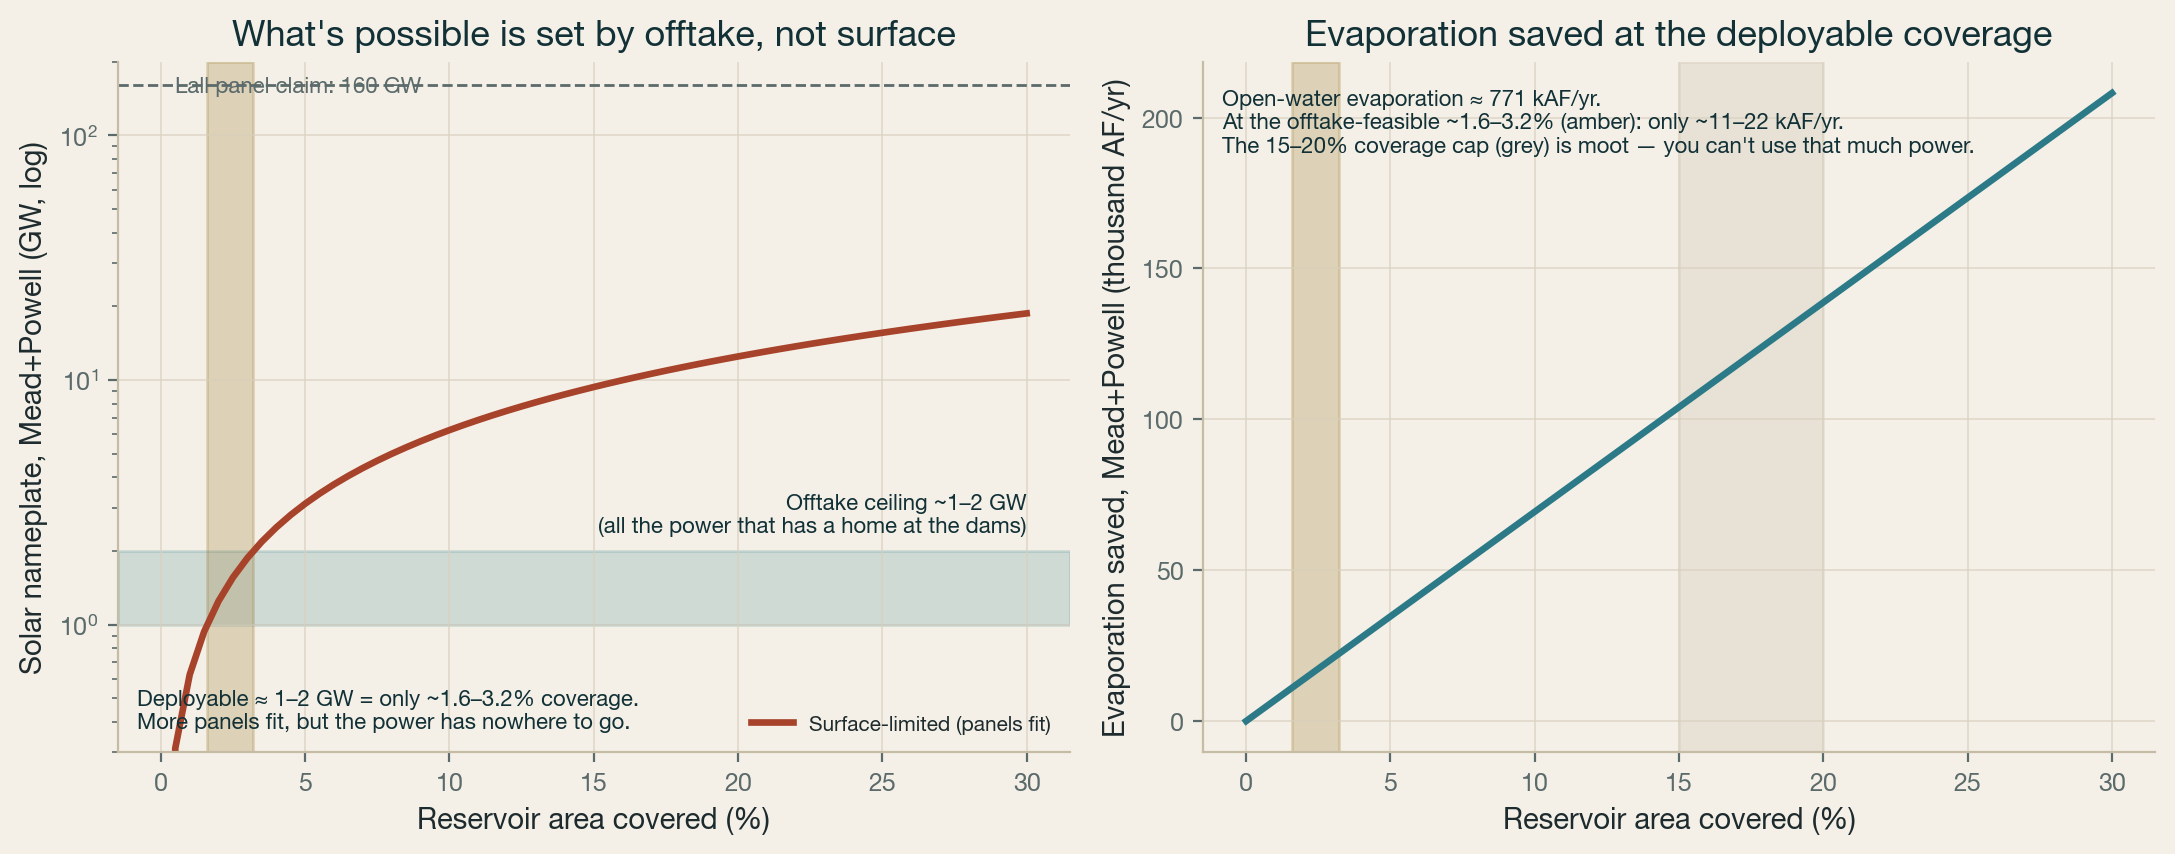
Prof. Lall proposed covering reservoirs with floating solar to cut evaporation and generate power. We tested it against the measured lake areas and against the one thing that actually limits it: where the power can go.
 Click to enlarge
Where would the power actually go? (the binding constraint)
Floating PV only counts if the electricity has a use. At Glen Canyon and Hoover the honest answer is narrow, so the amount you can actually deploy is set here, not by surface area:
- Not water-making. Desalination, reuse and canal pumping sit at the cities and canals, not at a remote dam. There is no water-making load to soak the power on-site.
- Pumped storage — Hoover only. LADWP's ~$3B proposal to pump Lake Mohave water ~20 mi back up to Lake Mead (Hoover runs at only ~20% capacity factor) is a real home for daytime solar. Glen Canyon has no lower reservoir, so on-site pump-back is not available there.
- Backfilling the fading hydro (the main use). Use solar midday so the dam holds water and shifts generation to the evening peak, on its existing interconnection and firm contracts. Reclamation is already rescheduling releases and weighing solar to offset hydro decline (Glen Canyon is down to ~800 MW). No new equipment, but capped by what the dam still generates and by mandatory downstream deliveries.
- Not the grid. ~0 GW of firm, uncontested transmission headroom; low-water derating makes the region a net importer; Southwest midday solar is already saturated.
Add those up and the power that has a clean home at the two dams is ~1–2 GW — which is why the deployable array is small.
Interactive: coverage vs. what's usable
Cover % of Mead+Powell with floating PV:
What actually binds at Mead & Powell — after the expert pushback
Prof. Lall pressed us on this, and he is right on one point: gigawatt-scale floating solar is real (China commissioned ~1 GW of open-sea FPV in 2025), and the annual level swing on these lakes is modest, a few feet. We had conflated that with the multi-year decline. Conceded. But the case against open-reservoir FPV on these two reservoirs specifically does not rest on annual mooring. It rests on four things, and the evidence still points our way:
- Cost. NREL benchmarks floating PV at roughly 25% above ground-mount ($0.26/W), from floats and anchoring. The claim of cost parity or better is not supported at this scale.
- Offtake. At Hoover and Glen Canyon we measured ~0 GW of firm, uncontested transmission headroom (above). Canal solar is typically self-consumed for pumping, behind the meter; a remote-dam array cannot do that. The grid constraint is real for both, but it bites harder here.
- The secular recession, not the annual swing. Powell is down 52% since 2019, measured 29 July 2026. Over a 25-year asset life the shoreline retreats hundreds of feet, stranding a fixed array on dry land and forcing it to migrate. The existing gigawatt installations sit on stable, sheltered, shallow water, not a canyon reservoir in a two-decade drawdown.
- NPS jurisdiction and the recreation economy. Lake Mead and Glen Canyon are National Recreation Areas; boating and houseboating are the regional economy, and there is no clean mechanism to lease federal reservoir surface for a private solar field. The Asian and offshore precedents are not sited over an NPS recreation area. This is the barrier the pushback did not address, and it is the decisive one.
On canal solar, the peer-reviewed evidence runs the other way from the "doesn't compute" view: McKuin et al. (Nature Sustainability, 2021) modeled 20–82% evaporation savings on covered California canals and found cable-supported spans pencil with 20–50% higher net present value, and Project Nexus is now measuring the losses in the field. The vapor-pressure-deficit critique is worth testing, but it does not overturn a peer-reviewed, modeled cost-positive result now being field-tested. Canal solar is self-consumed and on owned rights-of-way, which is why it clears the offtake and jurisdiction problems that reservoir FPV does not.
Castle — does efficiency save water?
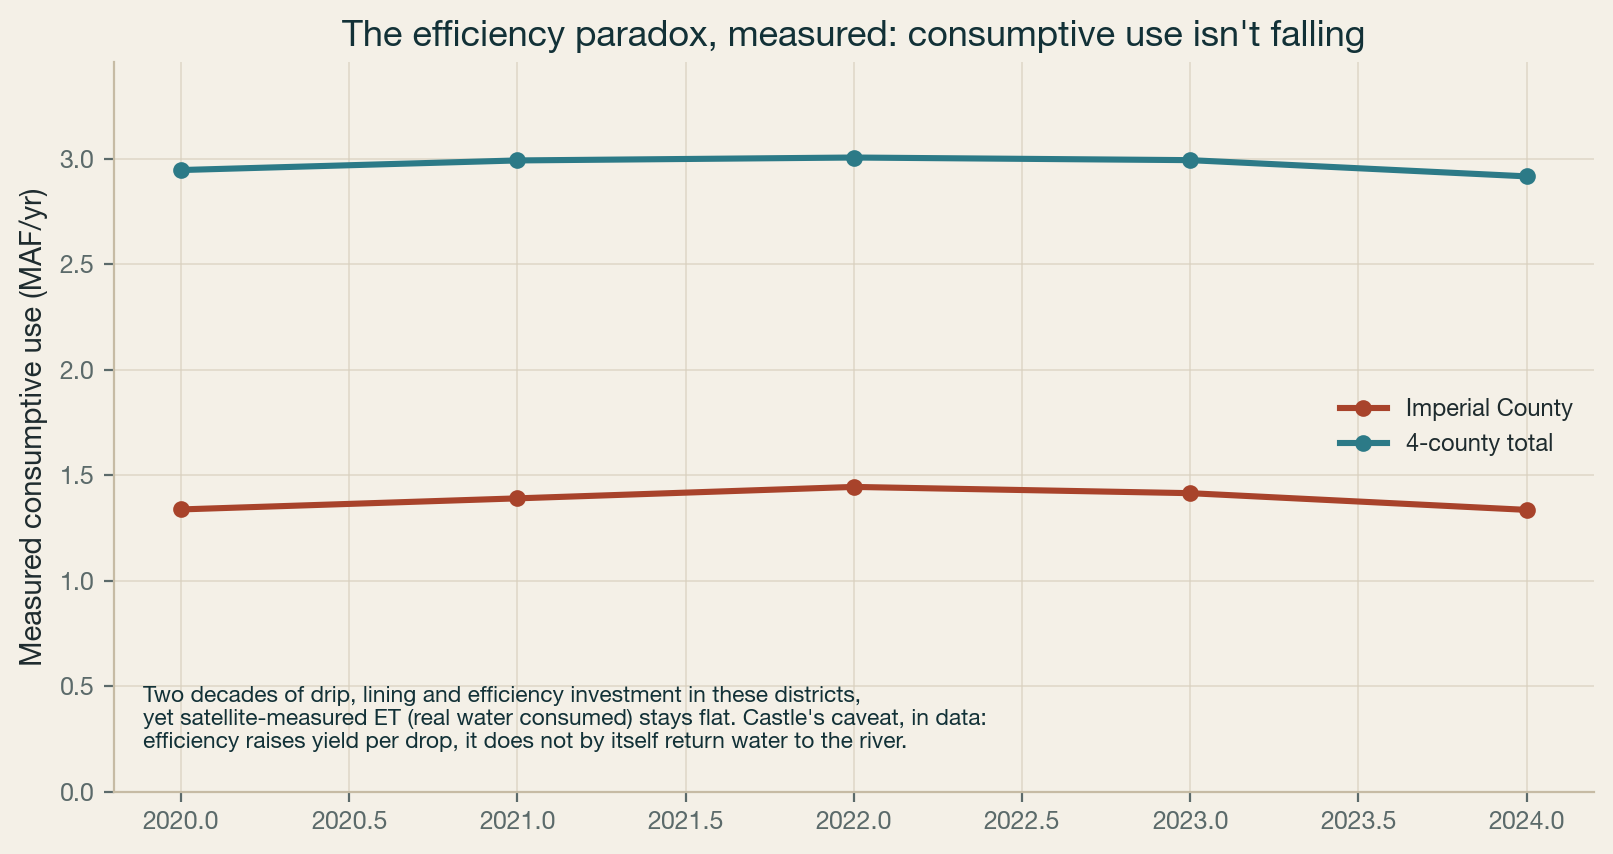
Anne Castle cautioned that efficiency raises yield per drop without returning water to the river. The measured record agrees.
 Click to enlarge
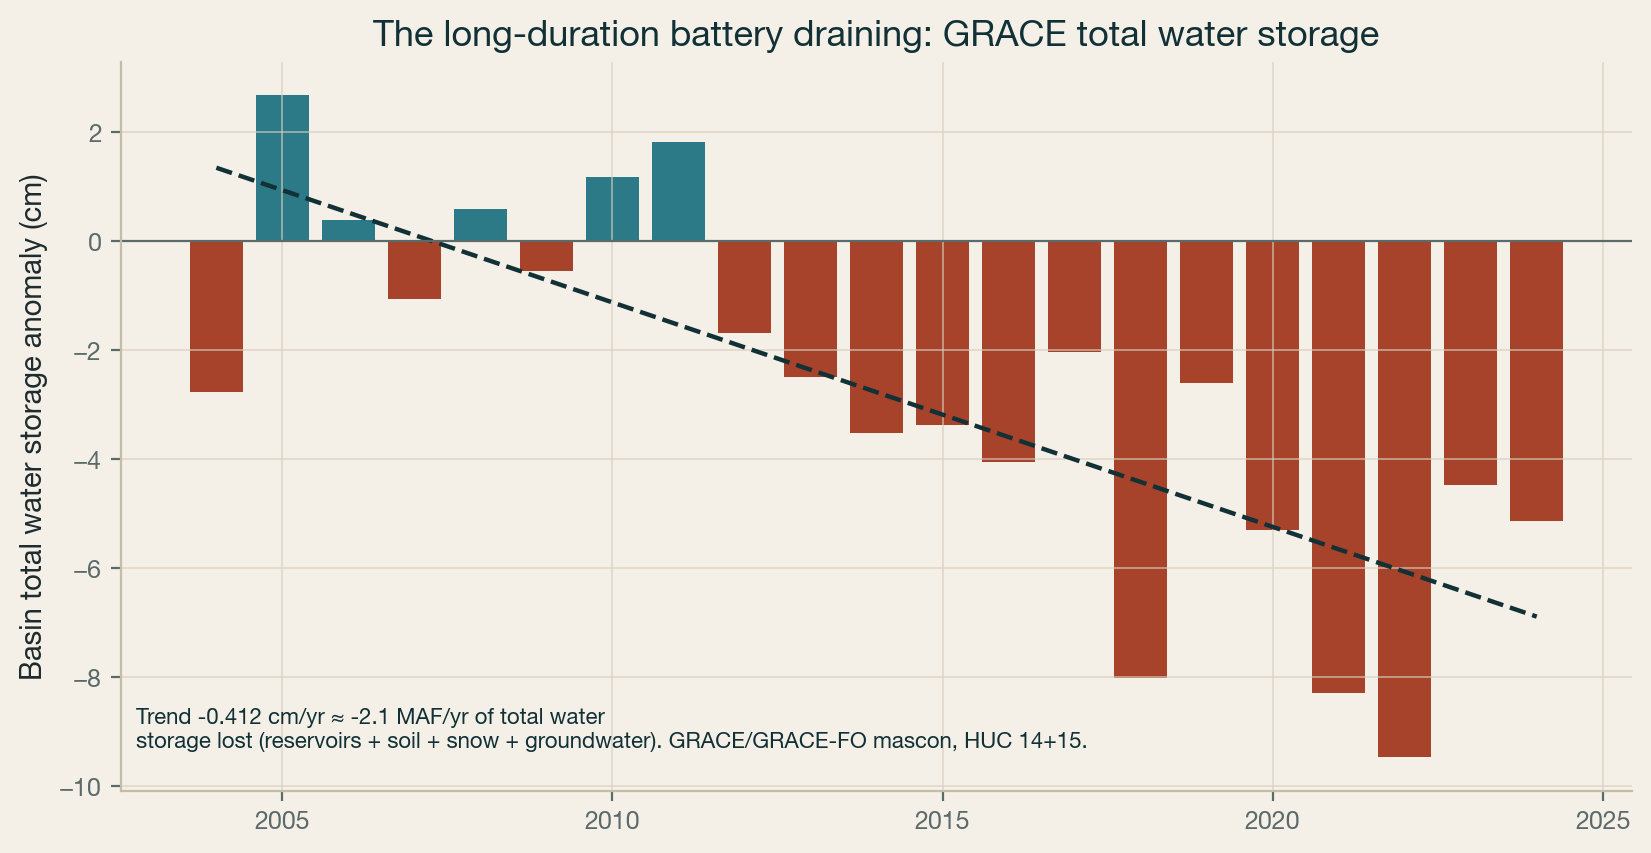
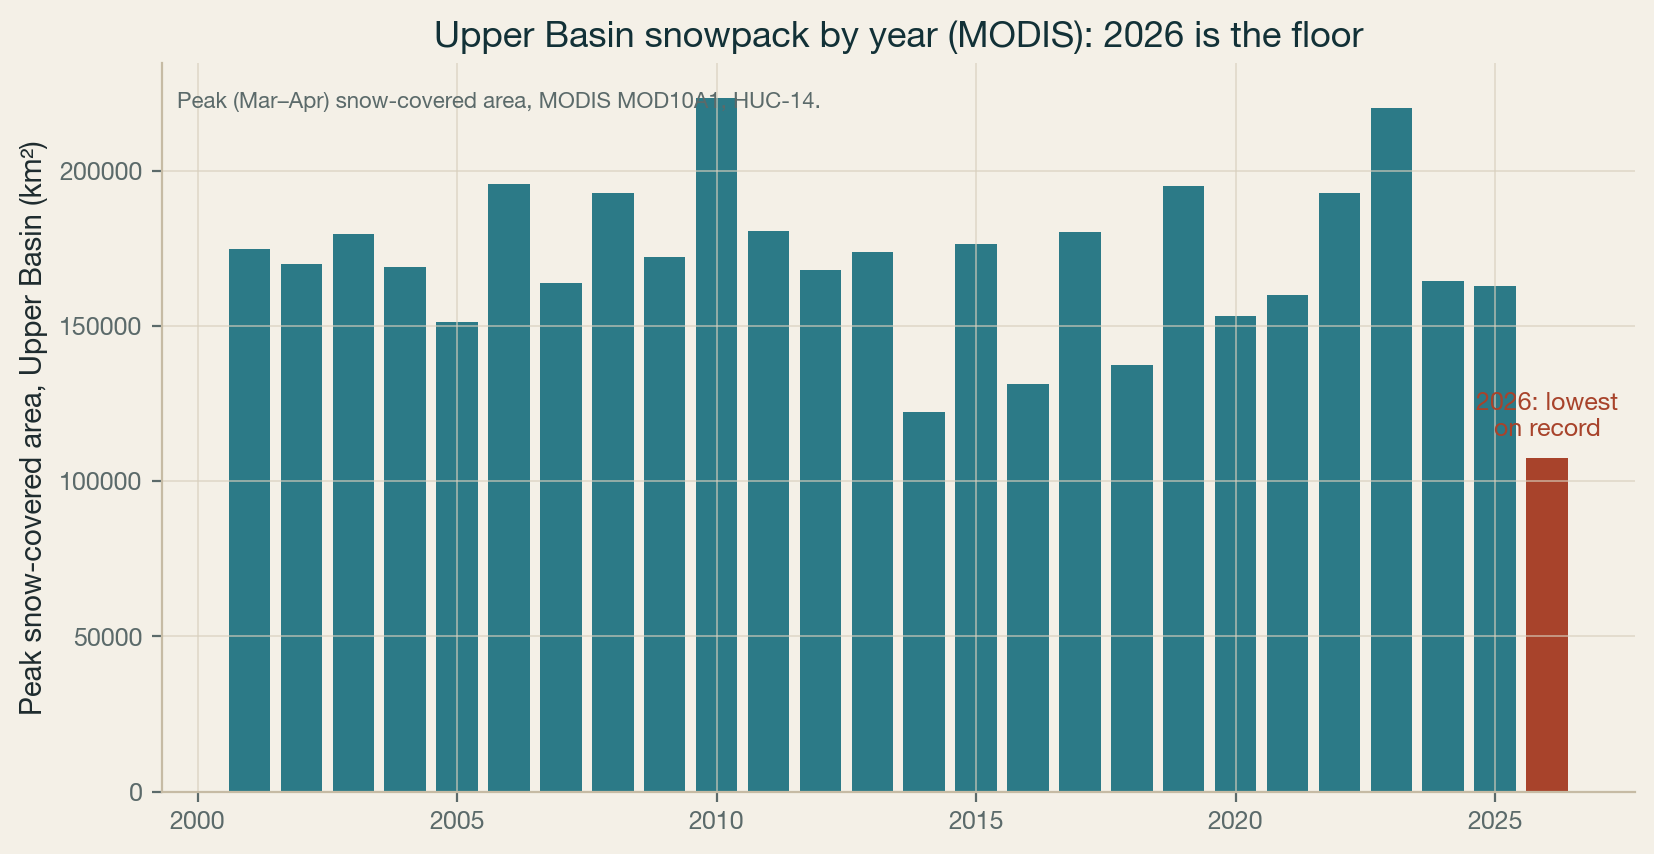
4. The long-duration batteries
 Click to enlarge
 Click to enlarge
Method & sources
All figures were computed on Google Earth Engine (Gorelick et al. 2017, Remote Sensing of Environment; project registered non-commercial) from public satellite and geospatial collections: OpenET ensemble evapotranspiration (Volk et al. 2024); Sentinel-2 (ESA Copernicus, MNDWI water extent); MODIS MOD10A1 (NASA NSIDC, snow-covered area); GRACE/GRACE-FO mascon (NASA JPL); the USDA Cropland Data Layer; ESA WorldCover; and USGS Watershed Boundary Dataset basin boundaries. Consumptive use is measured evapotranspiration, not diversions. The floating-solar figures use conservative panel-density and evaporation-suppression assumptions and are deliberately lower than the panel's spoken numbers. Independent work, not affiliated with any agency, utility, or investor. Draft for review.