An acre-foot costs between $80 and $30,000, depending on how you get it
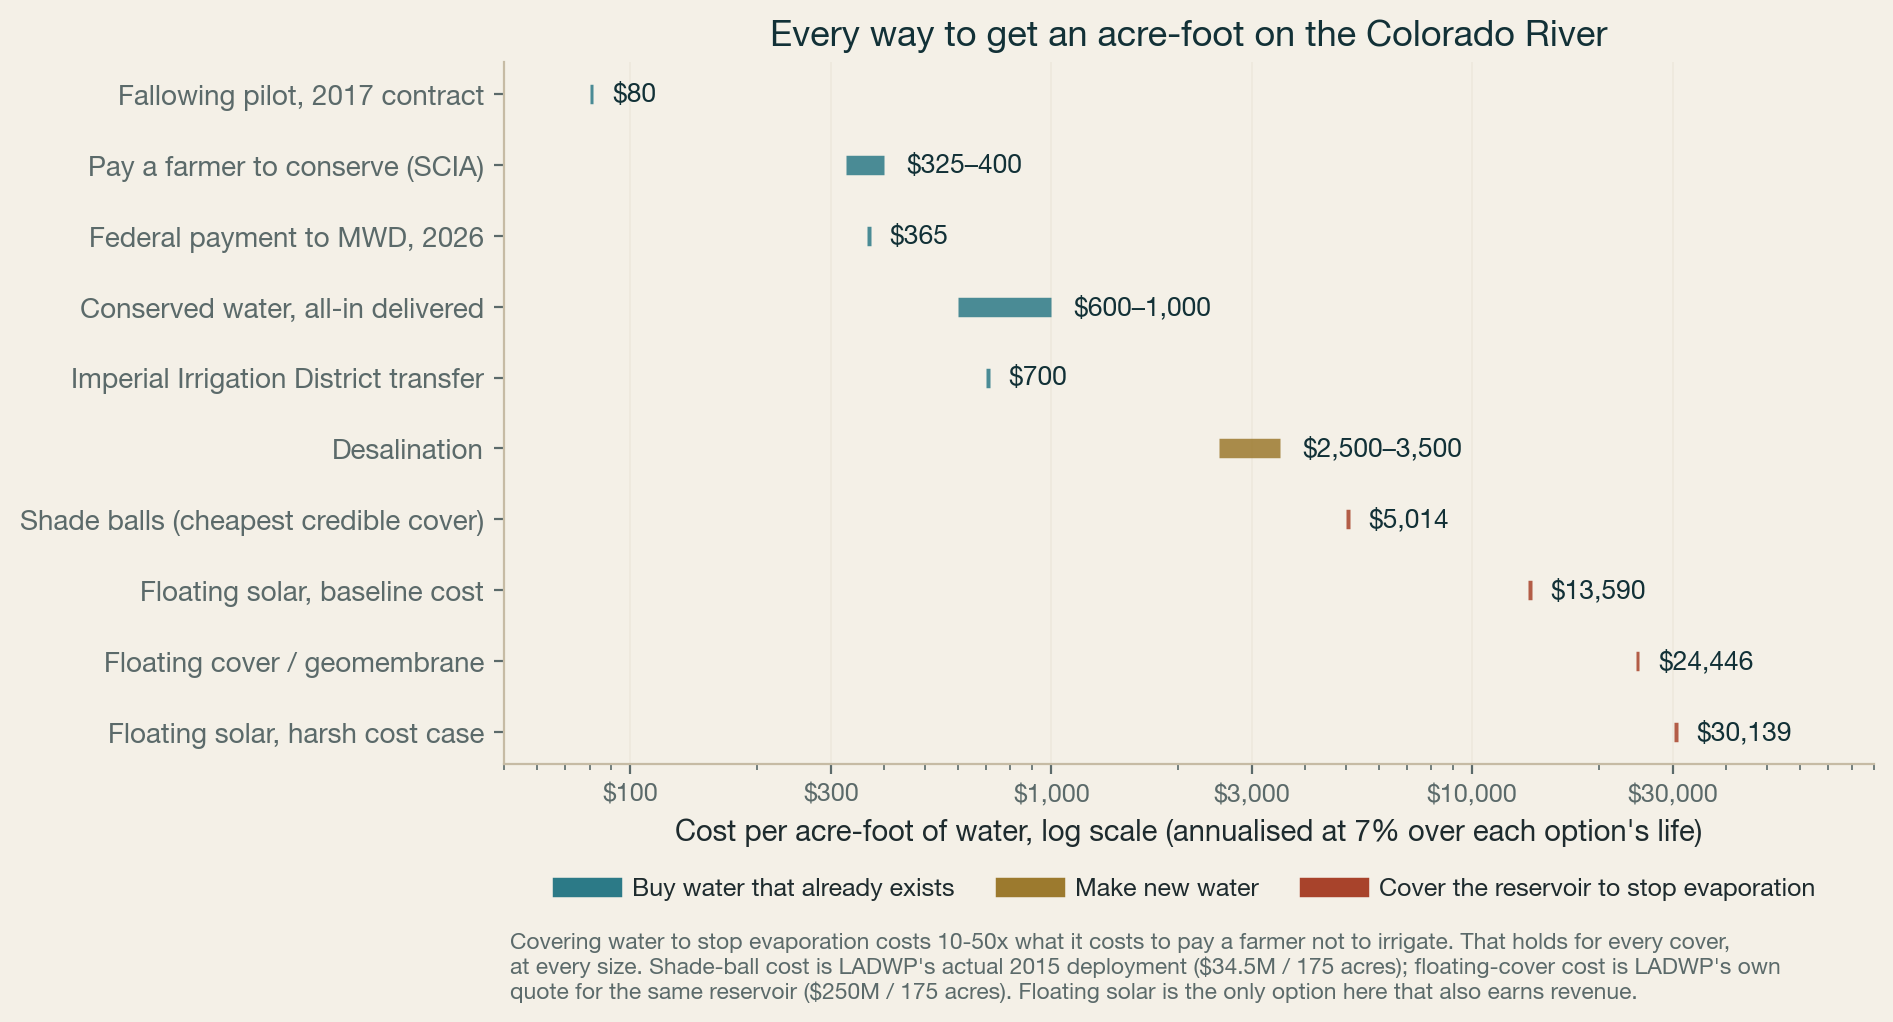
Every way to add water to the Colorado River, on one axis, with what makes each one financeable and what stops it.
 Click to enlarge
The cheapest water is bought, not built. Anything that manufactures water or protects it from evaporating costs several times what it costs to pay someone to stop using it.
That ordering is stable, and we can say how stable. Across every draw at every reservoir, the cheapest single outcome for suppressing water is $5,433 per acre-foot, roughly ten times the most expensive conserved water on the market. Not one combination of cost, discount rate and performance we sampled brings a cover within reach of buying the water instead. It is the first thing worth knowing before allocating anything, because it says that the binding constraint in basin water is not technology. Cheap water already exists. What is scarce is the contracting, measurement and verification that would let anyone buy it at scale.
Three tiers, and what each one can support
Buy water that already exists
$80 to $1,000 per acre-foot, SHORT TERMContracting now
What it is. Pay for consumptive use to stop, through the irrigation district rather than the grower. A grower generally holds a right to DELIVERY; the district holds the underlying entitlement, so the counterparty is a board and not a farm. Fallowing, deficit irrigation, crop switching, or a permanent transfer. The water is already in the river. The transaction moves who gets to use it.
Can it be financed. Strong on paper and narrower than it looks. There is a counterparty who pays per acre-foot, a price discovered in public board votes, and a measurable quantity. But the prices on the record are mostly SHORT-TERM, one to three years, and federally subsidised through system conservation programmes. They are not a market price for durable water. A buyer wanting twenty or fifty years of verified reduction is asking districts to give up optionality permanently, and every district person we have put this to says that is a different and dearer transaction. Treat the range on this page as the price of a short-term programme, not as the cost of the water a long-lived asset would need.
Where it breaks. The constraint is not supply, it is verification. Paying for conservation only works if the saving is real, additive and shepherded to where it was promised. That is a measurement problem rather than a technology problem, and it is the cheapest problem on this page by a wide margin. But calling what remains administrative understates it. Satellite evapotranspiration at field resolution is already published for the basin at no cost, and it measures consumptive use well. It does not by itself establish a counterfactual. The hard parts are ADDITIONALITY, whether the field would have been fallowed anyway, and LEAKAGE, whether the saved water is simply picked up by the next user down. Those are the two questions that kill conservation credits, and neither is solved by better remote sensing. We previously put a dollar figure on this and have removed it, because we could not source it.
Make new water
$2,500 to $3,500 per acre-footContracting now, long build
What it is. Treat a supply that was not previously usable. Advanced purification of municipal wastewater, or seawater desalination with an exchange agreement.
Can it be financed. Good, and it looks like conventional infrastructure. Municipal offtake, long-dated, rate-based, inflation-linked. Reuse in particular has a public counterparty with an obligation to serve.
Where it breaks. Capital-intensive and slow to permit. Reuse costs vary by more than twofold between projects depending on how far the water has to be moved and what it has to meet.
Cover the water to stop evaporation
$5,014 to $30,139 per acre-footNot financeable as a water asset
That range starts at shade balls. A chemical monolayer film prices below it at $382 per acre-foot and is left out of the range because it has repeatedly failed in open-reservoir field trials, not because it sits outside this tier.
What it is. Put something on the surface so less of it evaporates. Shade balls, floating covers, chemical films, or floating solar.
Can it be financed. Weak today, and an investor would say the reason is usually misdiagnosed. Water salvaged from evaporation on a mainstream federal reservoir cannot be held as private property: there is no mechanism under the 1922 Compact or the Arizona v. California decree for that, and the saving accrues to the system. But capital does not require owning a molecule. It requires a creditworthy counterparty paying under a contract long enough to amortise the asset, and plenty of infrastructure is financed as a contracted SERVICE rather than an owned commodity. System conservation payments already work that way. So the binding constraint is not that the water cannot be owned. It is that no instrument exists today under which anyone contracts to pay for measured evaporation suppression, and the saving is not yet measurable to a standard a payer would accept. Those are solvable. Neither is solved, and until one is there is no cash flow to underwrite.
Where it breaks. Also the most expensive water on the river by a wide margin, and none of it has been demonstrated at the scale of a large fluctuating reservoir.
Four questions that decide whether basin water is financeable
Cost per acre-foot sorts the options. It does not tell you which can carry capital. These do.
Is there a counterparty who pays per acre-foot?
Conservation and reuse both have one. Evaporation suppression does not, because the water it saves belongs to the system rather than to whoever paid for the cover.
Can the acre-feet be measured and audited?
Consumptive-use reduction can be measured from satellite. Reuse volumes are metered. Evaporation suppressed under a floating array has never been measured at reservoir scale, and the physics is unhelpful: heat not lost as vapour warms the water and raises evaporation on the open surface nearby, so the saving is smaller than the shaded area implies.
Is the saving additional, or would it have happened anyway?
The hardest question in conservation finance, and the one that decides whether a credit survives scrutiny. A fallowing contract in a year the field would have gone dry regardless is not a saving.
Does the contract run long enough to finance?
Most conservation payments are annual or short-term. Infrastructure capital wants a decade or more. The gap between the two is the single biggest structural obstacle in basin water finance, and it is a contracting problem rather than a technical one.
Notice that the third tier fails on the first two questions rather than on cost. The water it saves cannot be held as private property, and the saving has never been measured at reservoir scale. Neither is a cost problem, so neither is fixed by the technology getting cheaper. Both could in principle be addressed, the first by an instrument that pays for a measured service rather than for title to water, the second by actually instrumenting a reservoir. Until someone does, there is nothing to underwrite.
What we ruled out, including our own work
We spent considerable effort building an hourly model of floating solar across seven Colorado River reservoirs, on the expectation that covering water and generating power would prove complementary. It does not. The two benefits do not scale together: suppressed evaporation rises steadily with coverage while sellable energy stops at whatever the dam's transmission line can carry. Coverage targets of 15 to 20 percent, which circulate in policy discussion, exceed that bound at every reservoir we examined.
Propagating uncertainty across 12 parameters, the median cost of water suppressed by floating solar is $19,139 per acre-foot at Lake Mead, with a P10 to P90 range of $12,980 to $30,587. That figure is already net of every dollar the panels earn selling power. Non-generating covers are cheaper and still do not close the gap:
| Option | Capital per acre | Life | Suppression | Cost per acre-foot, before any power revenue |
|---|---|---|---|---|
| Chemical monolayer (cetyl alcohol film) | $200 | 1 yr | 9% | $382 |
| Floating cover, raw water (industrial spec) | $262,388 | 35 yr | 90% | $3,854 |
| Shade balls (hollow HDPE spheres) | $197,143 | 10 yr | 90% | $5,014 |
| Floating PV (this model, baseline cost) | $597,317 | 25 yr | 75% | $13,590 |
| Floating modular cover / geomembrane | $1,428,571 | 20 yr | 90% | $24,446 |
| Floating PV (reviewers' harsh cost case) | $1,214,058 | 25 yr | 75% | $30,139 |
Two of those numbers describe floating solar and they are not the same measurement. The table prices the cover alone, before any power revenue, at one generic reservoir acre. The $19,139 above is Lake Mead specifically, net of power sales, with the array sized against Hoover's actual transmission line rather than assumed to cover everything. The site-specific number is the higher of the two, but not because the export limit outweighs the power revenue. Revenue always reduces the cost. It is higher because it is a median across sampled capital costs that reach the harsh mooring and biofouling case, while the table holds capital at one baseline. Read the table for the ranking between technologies and the Monte Carlo for how much any of it could move.
Cost is only half of an allocation decision. The other half is how much there is. Everything above prices an acre-foot without saying how many are available, which is not much use next to a shortfall measured in millions. Two of the three tiers can now be sized.
Reuse was surveyed properly for the first time in 2025. UCLA's Institute of the Environment and Sustainability, with the NRDC, went through publicly owned treatment works across all seven basin states for 2022 and found 26% of treated municipal wastewater is reused. The spread between states is enormous: Nevada 85%, Arizona 52%, California 22%, New Mexico 18%, and under 4% in Colorado, Wyoming and Utah. Bringing the basin to 40% would free about 900,000 acre-feet a year. Bringing it to 50% would free about 1,300,000.
Set that against the option this project spent the most effort on. Covering each of the seven reservoirs modelled here to its own transmission-limited bound, which takes 5,316 MW of floating panel, suppresses 49,865 acre-feet a year. That is seven reservoirs, not the whole basin, and it is the size at which nearly everything built still sells rather than spills. That is 26 times less than the reuse headroom, at roughly seven times the cost per acre-foot, and it covers 1.7% of the shortfall the basin is arguing about.
| Option | Acre-feet per year | Share of a 3.0 maf shortfall |
|---|---|---|
| Reuse, basin raised to 50% | 1,300,000 | 43% |
| Reuse, basin raised to 40% | 900,000 | 30% |
| Floating solar, all seven reservoirs at their bound | 49,865 | 1.7% |
Two honest qualifications. These are not interchangeable goods: suppressed evaporation stays in the reservoir and has no owner under the Law of the River, while reused effluent is a supply a utility can contract for, which is the ownership problem this page opened with. And the reuse figures come with an unusually severe caveat from their own authors, who describe a data desert. Most states do not systematically track reuse and the researchers telephoned treatment plants one at a time. Only California runs an open portal. Those are the best numbers anyone has, and they are survey estimates rather than a measurement system.
Neither qualification changes the ranking. An option that is 26 times larger and roughly seven times cheaper does not lose to one that is smaller and dearer because its accounting is imperfect.
Two things a tribal water attorney would add, and the second is uncomfortable.
- Tribal water cannot simply be bought and moved. Tribal nations hold on the order of a quarter of the basin's rights, much of it senior to everything around it. But moving tribal water off-reservation is constrained by federal law and commonly requires Congressional authorisation, so a market that works for an irrigation district does not automatically work for a tribe. Any analysis that prices basin water without saying this describes a market that excludes its largest senior rights-holders.
- Monetising existing uses can harden the status quo before tribal claims are settled. This is the part that cuts against our own argument. If conserved agricultural water becomes a liquid, well-funded commodity, the parties holding quantified water gain a revenue stream and a reason to defend the current allocation. Nations whose rights are real but not yet quantified do not have that, and their claims sit against a system that has become more expensive to rearrange. We are recommending a market that could disadvantage the people with the oldest claims on the river, and a reader should hear that from us rather than discover it.
What the sellers say, which is the part this page was missing. Everything above prices water. None of it asked the only people who can supply the cheap rung whether they would sell. Put to irrigation district managers and growers, the answer was consistently "it depends", and the conditions are not small.
- The counterparty is a district board, not a farmer. A grower typically holds a right to delivery while the district holds the underlying entitlement. An analysis that talks about paying farmers has the wrong party on the other side of the contract.
- The published prices are short-term and subsidised. System conservation payments run one to three years with federal money behind them. A buyer who needs twenty or fifty years of verified reduction is asking a district to surrender optionality permanently, and that is a different and more expensive transaction. Our own ladder quotes the programme price, and it should not be read as the cost of durable water.
- Fallowing is not a pause. Ground taken out of production accumulates salt, loses soil biology, grows weeds, blows dust, and costs real money to bring back. Rotations break. Equipment sits. None of that appears in a price per acre-foot.
- Third-party effects decide board votes. A district that fallows at scale moves work away from labour, packing sheds, gins, equipment dealers and the tax base that funds local schools. Districts have watched transfers sold as temporary become permanent. Boards reject deals for these reasons far more often than for measurement reasons.
- Price per acre-foot is the wrong instrument on its own. What decides a deal is who carries dry-year risk, whether payment is for gross fallowed acres or verified net consumptive-use reduction, what reverts at the end, and what mitigation the community gets.
This does not overturn the ranking. Conserved water is still the cheapest real water on the river and still an order of magnitude below any cover. It narrows what the ranking means. The cheap price is a short-term programme price, the counterparty is an institution with obligations to a community, and a durable supply costs more than this page previously implied. We were told the same thing from three directions and it is the most useful correction the analysis has received.
One thing they said we got right, and it is worth keeping because outsiders reliably get it wrong: efficiency is not conservation. Funding drip irrigation or canal lining does not save the river if consumptive use does not fall, and canal seepage is frequently somebody else's return flow. This site has refused to credit efficiency as conservation from the start.
What an investment committee would object to, and it is worth stating rather than burying. This page compares options on cost per acre-foot, annualised at a single 7% cost of capital. A project financier would object to both moves.
- One discount rate flatters the risky options. A chemical film with a one-year life and a record of field failure does not deserve the same cost of capital as a utility-scale solar plant. Real pricing would push the unproven options up and spread the ranking further apart, so the ordering survives, but the ladder is a screen and not a cost of capital.
- Netting power revenue against a water cost is not something a lender would allow. Our floating-solar figure nets merchant day-ahead revenue against the array's capital cost and divides by acre-feet. That produces a number that is useful for comparing technologies and that no bank would underwrite, because merchant revenue is not contracted and cannot secure debt against a water obligation. The gross figure is the one a financier would start from: $13,590 per acre-foot before any power sale, against roughly $19,000 net at Lake Mead once uncertainty is carried. Both are on this page and they answer different questions.
- Cost per acre-foot hides scale, timing and firmness. An acre-foot of conserved agricultural water available under an annual contract is not the same product as an acre-foot of reuse capacity available in 2031 under a thirty-year municipal obligation. The ladder ranks price. It does not rank bankability, and the two orderings are not the same.
None of this changes which option is cheapest. It changes what the ranking is evidence for. It is evidence about where to look, not a capital structure.
One more thing the table does not do. Every option is annualised at the same 7% cost of capital, which is what makes a ten-year ball comparable to a twenty-five-year array, but it also assumes a monolayer film that has repeatedly failed in the field, a quoted cover, and a utility-scale solar plant all carry the same financing risk. They do not. A real financing would price the unproven options higher and the ranking would spread further apart, not closer together, so the ordering survives. Read the table as a screen on cost, not as a cost of capital.
One row there is not trustworthy, and it is worth saying so. The floating-cover figure comes from a utility's own quote to cover their own reservoir, which is a real number, but it prices a potable-water cover: sealed, tensioned, food-grade, built to isolate treated drinking water. An evaporation cover on a raw reservoir is a different and cheaper product. Read that $1.4 million per acre as a ceiling rather than a price. We found no published cost for a raw-water evaporation cover at reservoir scale, and two estimates for that row have now been wrong in opposite directions, so treat it as unresolved. Nothing below depends on it: shade balls are the cheapest credible cover either way, and they still lose to conservation by an order of magnitude.
Desalination beating every cover is the counterintuitive result, and the reason generalises. A cover's yield is capped by physics: an acre of covered water saves only the depth that would have evaporated off it, roughly 5.6 acre-feet a year in the Lower Basin, and no engineering improves that. A treatment plant has no such ceiling. Covers spread industrial capital across enormous areas to harvest a thin layer, which is why the category loses on cost before it loses on law.
We publish that finding because it went against the direction we started in. The full model, its uncertainty bounds, its validation against independent measurements and the findings of two rounds of outside adversarial review are on the technical paper, including the objections we have not resolved.
Where that leaves an allocator
Verified agricultural conservation is the cheapest water in the basin and the constraint is measurement. Roughly three quarters of consumptive use is agricultural, so a ten percent reduction frees more than a million acre-feet, which is the largest single block available. The price is on the public record. What is missing is the verification infrastructure that turns a fallowing contract into an auditable, bankable acre-foot, and that infrastructure is the cheapest line on the chart.
Potable reuse is the closest thing in basin water to conventional infrastructure. Our screen of publicly reported treatment plants across the seven basin states identifies on the order of four hundred facilities at a scale where advanced purification is plausible, concentrated in Arizona, California, Colorado and Utah. That is a screen and not a diligenced pipeline: regulatory status differs by state, and most individual plants still need their reuse status confirmed before anyone should act on them. But the category has what the others lack, which is a public counterparty with an obligation to serve and a rate base to pay.
The structural gap is contract duration. Conservation payments are mostly annual. Infrastructure capital wants a decade or more. Nothing in the basin's current arrangements bridges that, and whoever builds the instrument that does will unlock the cheapest water on the chart. That is a financial engineering problem, not a hydrological one.
What this analysis is
Independent work, built from public data. Reservoir surfaces measured from satellite imagery, evaporation from direct flux measurements where they exist, prices from published market and board records, and every model output validated against independently produced figures. The code and data are public and the assumptions are all exposed. Where a number is a screening estimate rather than a measurement, it says so.